
What is ChartDB?
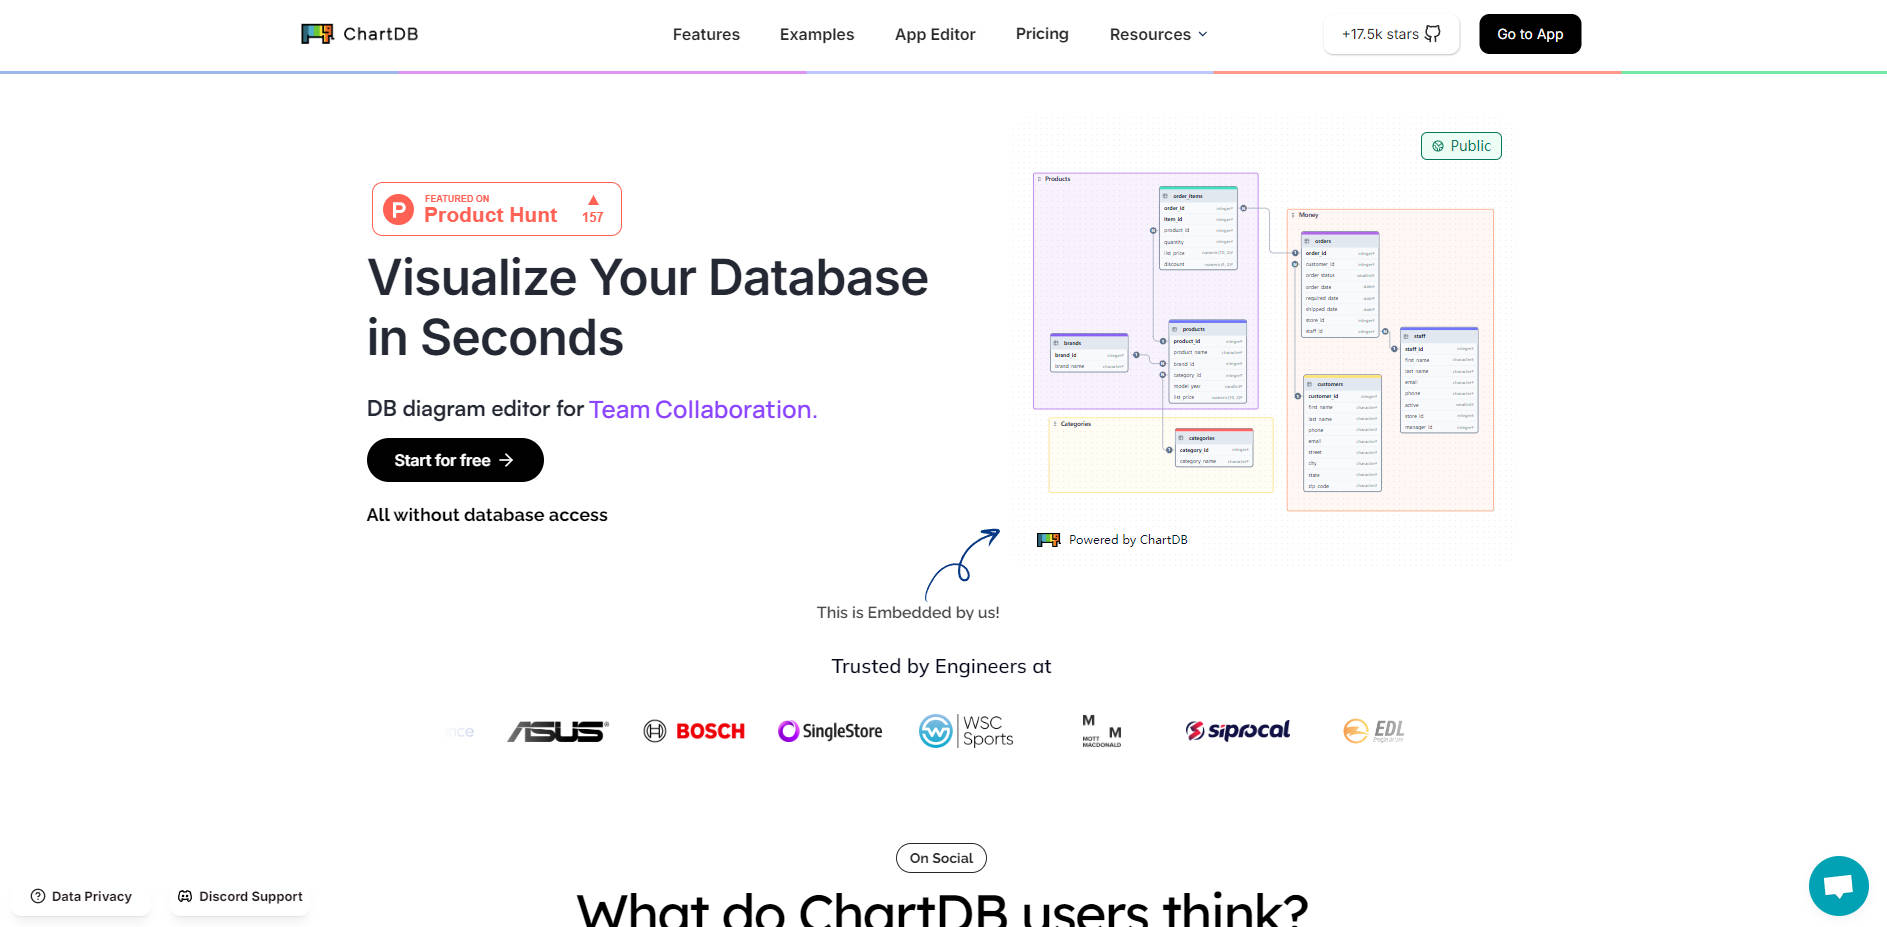
ChartDB is a powerful, open-source diagram editor designed for developers, database administrators, and software architects. It streamlines the process of visualizing, designing, and documenting your database schemas, allowing you to generate a complete relationship diagram from a single query—all without requiring direct database write access.
Key Features
⚡️ Instant Schema Import: Generate a full database diagram in as little as 15 seconds. ChartDB uses a single, read-only query to fetch your entire schema, including tables, columns, and relationships, saving you hours of manual diagramming.
🤝 Real-Time Collaboration: Invite your team to view and edit diagrams simultaneously. Work together on database design, review changes, and ensure everyone is aligned, whether you're in the same room or across the globe.
🔄 Export to SQL and Sync: Effortlessly generate clean Data Definition Language (DDL) scripts in your preferred SQL dialect directly from your diagram. Keep your diagrams current with one-click re-imports that update the schema while preserving your manual layout adjustments.
📚 Beautiful, Sharable Documentation: Create clear, interactive, and embeddable diagrams for your documentation. Share a live version of your Entity-Relationship Diagram (ERD) in platforms like Notion, Miro, or Confluence to keep your entire organization informed.
📈 Track Schema Changes: Maintain a reliable history of your database structure. ChartDB allows you to see diffs and review version history, making it easy to monitor updates and understand how your schema has evolved over time.
Use Cases
Onboarding New Team Members: When an engineer joins a project with a complex database, you can provide them with an instant, easy-to-understand visual map of the entire schema. This dramatically reduces their ramp-up time and helps them contribute faster.
Designing New Features: Your team can collaboratively brainstorm and design new tables and relationships in a shared visual workspace. Once the design is finalized, you can export the DDL script to implement the changes directly in your database.
Maintaining Technical Documentation: Instead of static, outdated images, you can embed a live, interactive ChartDB diagram into your internal wiki or documentation. This ensures that your technical and non-technical stakeholders always have access to the most current view of your database architecture.
Why Choose ChartDB?
ChartDB is built to provide a seamless, end-to-end workflow for database visualization and design. Its core value lies in its combination of speed, flexibility, and collaboration.
Unmatched Speed and Simplicity: Go from a complex database to a clear, visual diagram in seconds. The single-query import process eliminates the tedious and error-prone task of manual diagramming.
Total Flexibility (Cloud vs. Self-Hosted): Choose the option that fits your needs. Use the ChartDB Cloud for instant, browser-based access and team collaboration, or deploy the free, open-source version on your own infrastructure for complete data control and customization.
From Visualization to Implementation: ChartDB is more than just a viewer. It supports the full development lifecycle, allowing you to import an existing schema, modify it collaboratively, and export the necessary SQL scripts to apply your changes.
Frequently Asked Questions (FAQ)
1. Does ChartDB modify my database in any way?No. The import process is strictly read-only. ChartDB only fetches schema metadata (like table names, columns, and relationships) to build your diagram and never performs any write operations on your database.
2. Can I embed a live diagram in tools like Notion or Confluence?Yes. You can generate a shareable link for your diagram and embed it as an iframe in any platform that supports it. This allows you to include a live, interactive ERD directly within your project documentation.
3. How does ChartDB handle very large schemas with thousands of tables?ChartDB is designed to support large diagrams. For exceptionally large schemas, it is recommended to import specific namespaces or filter tables first to ensure optimal performance. The auto-layout feature helps organize complex diagrams efficiently.
More information on ChartDB
Launched
2024-08
Pricing Model
Freemium
Starting Price
US$19 /month
Global Rank
263697
Follow
Month Visit
134.3K
Tech used
Fathom Analytics,Framer,Google Fonts,Gzip,HTTP/3,OpenGraph,HSTS
Top 5 Countries
10.19%
9.77%
6.23%
4.83%
4.08%
United States
Vietnam
India
Mexico
Ecuador
Traffic Sources
4.66%
0.88%
0.12%
14.44%
43.23%
36.62%
social
paidReferrals
mail
referrals
search
direct
Source: Similarweb (Sep 24, 2025)
ChartDB was manually vetted by our editorial team and was first featured on 2024-08-30.
ChartDB Alternatives
Load more Alternatives-

RapidChart AI: Turn text/code into professional technical diagrams (UML, C4, ER) fast. Essential for developers, architects, engineers.
-

Platform for creating AI Powered Diagrams with features like AI generation, themes, fonts, different AI models including GPT3.5 and GPT4
-

Lucidchart uses AI & data to simplify complex processes. Visualize, optimize, and collaborate in real-time for smarter decisions and efficient workflows.
-

Access database data instantly with natural language. Skip SQL! Get charts & insights from PostgreSQL, MySQL, MS SQL. Secure, private, and easy to use.
-
