 Chart
Chart
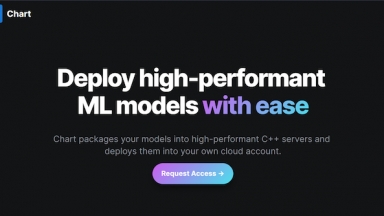
Chart packages your models into high-performant C++ servers and deploys them into your own cloud acc
 PlotCh.at
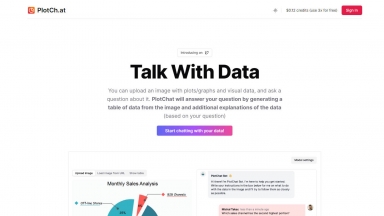
Talk With Data's PlotChat: Upload plot images, generate data tables, and get question-based explanations. Simplify data interpretation and gain insights with this powerful AI tool.
Chart
| Launched | 2022-07-07 |
| Pricing Model | Contact for Pricing |
| Starting Price | |
| Tech used | Webflow,Amazon AWS CloudFront,Google Fonts,jQuery,Gzip,OpenGraph |
| Tag |
PlotCh.at
| Launched | |
| Pricing Model | Freemium |
| Starting Price | |
| Tech used | |
| Tag | Data visualization |
Chart Rank/Visit
| Global Rank | 0 |
| Country | |
| Month Visit | 0 |
Top 5 Countries
85.85%
14.15%
United States
Ireland
Traffic Sources
67.88%
32.12%
0%
Referrals
Direct
Search
PlotCh.at Rank/Visit
| Global Rank | 10195414 |
| Country | |
| Month Visit | 988 |
Top 5 Countries
55.14%
44.86%
Turkey
Viet Nam
Traffic Sources
0%
0%
0%
0%
0%
0%
Social
Paid Referrals
Mail
Referrals
Search
Direct
What are some alternatives?
When comparing Chart and PlotCh.at, you can also consider the following products
ChartPixel - Go beyond visualization and gain valuable insights with ChartPixel's AI-assisted data analysis — fast and no matter your skill level
ChartGPT - Create visually appealing charts quickly and efficiently with CHARTGPT. Automate the process using AI and save time. Try it now on GitHub!
grafychat - The Ultimate Frontend UI for ChatGPT and other conversational AI • Expand ideas on canvas • Leverage every AI feature • Maximize control • Keep your data private Bring your API keys and start chatting!
GraphMaker AI - Create a professional chart for free with the first AI-powered graph maker. Make custom bar charts, scatter plots, pie charts, histograms, and line charts in seconds.