 ChartGen.ai
 ChartPixel
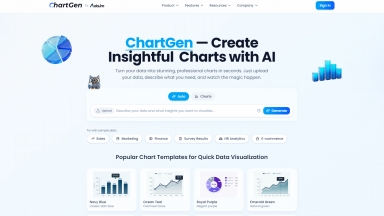
ChartGen.ai
| Launched | 2025-12 |
| Pricing Model | Freemium |
| Starting Price | |
| Tech used | |
| Tag |
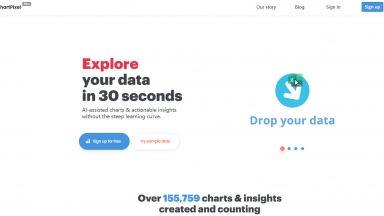
ChartPixel
| Launched | 2020-12 |
| Pricing Model | Freemium |
| Starting Price | |
| Tech used | cdnjs,Cloudflare CDN,JSDelivr,Google Fonts,Bootstrap,jQuery,Gzip,JSON Schema,OpenGraph,HSTS |
| Tag | Data Visualization,Data Analysis |
ChartGen.ai Rank/Visit
| Global Rank | |
| Country | |
| Month Visit |
Top 5 Countries
Traffic Sources
ChartPixel Rank/Visit
| Global Rank | 1574981 |
| Country | India |
| Month Visit | 16627 |
Top 5 Countries
Traffic Sources
Estimated traffic data from Similarweb
What are some alternatives?
ChartFast - AI data analyst tool designed to streamline your data visualization and analysis tasks. It automates repetitive and time-consuming data work, allowing you to generate precise and sleek graphs in seconds.
Viz Graph Maker - AI Graph Maker simplifies data viz. Create stunning graphs in clicks with AI. Responsive, customizable, multi-format export. Ideal for pros & beginners.
GraphMaker AI - Create a professional chart for free with the first AI-powered graph maker. Make custom bar charts, scatter plots, pie charts, histograms, and line charts in seconds.
Graphy - Graphy's AI transforms messy data into professional, insightful graphs in seconds. Create clear, presentation-ready visuals for faster decisions & powerful communication.