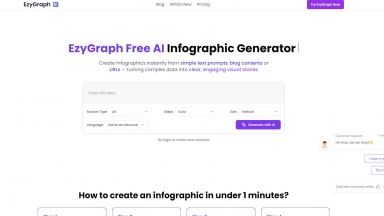
 EzyGraph
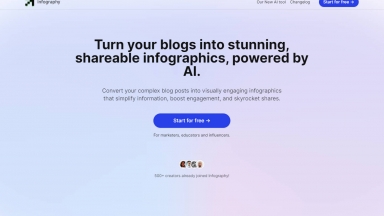
 Infography
EzyGraph
| Launched | 2024-08 |
| Pricing Model | Freemium |
| Starting Price | $4.9/month |
| Tech used | Google Analytics,Cloudflare CDN,Next.js,Vercel,Gzip,HTTP/3,OpenGraph,Webpack,HSTS |
| Tag | Text To Infographic |
Infography
| Launched | 2024-02 |
| Pricing Model | Paid |
| Starting Price | $9.99 /month |
| Tech used | JSDelivr,unpkg,Google Fonts,Svelte(Kit),Vercel,Gzip,JSON Schema,OpenGraph,HSTS,YouTube |
| Tag | Text To Infographic,Content Creation,Social Media Marketing |
EzyGraph Rank/Visit
| Global Rank | 3854600 |
| Country | Vietnam |
| Month Visit | 4949 |
Top 5 Countries
Traffic Sources
Infography Rank/Visit
| Global Rank | 512679 |
| Country | India |
| Month Visit | 71736 |
Top 5 Countries
Traffic Sources
Estimated traffic data from Similarweb
What are some alternatives?
Text2Infographic - Text to Infographic is an AI Infographic Generator that turns your text into visuals for your blog, social media, and more.
GraphicInfo - Create engaging Infographic from your articles with our AI-powered tool.
Graphy - Graphy's AI transforms messy data into professional, insightful graphs in seconds. Create clear, presentation-ready visuals for faster decisions & powerful communication.
Visual Infograph AI Dash - Create compelling infographics in minutes! Visual Infograph AI Dash uses AI to transform your data. Perfect for reports, presentations & marketing.
Viz Graph Maker - AI Graph Maker simplifies data viz. Create stunning graphs in clicks with AI. Responsive, customizable, multi-format export. Ideal for pros & beginners.