 PlotCh.at
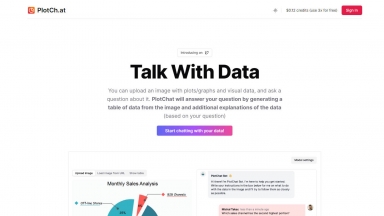
Talk With Data's PlotChat: Upload plot images, generate data tables, and get question-based explanations. Simplify data interpretation and gain insights with this powerful AI tool.
 Diagram.chat
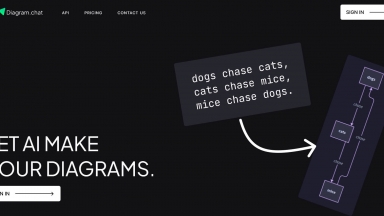
Platform for creating AI Powered Diagrams with features like AI generation, themes, fonts, different AI models including GPT3.5 and GPT4
PlotCh.at
| Launched | |
| Pricing Model | Freemium |
| Starting Price | |
| Tech used | |
| Tag | Data visualization |
Diagram.chat
| Launched | 2023-07-12 |
| Pricing Model | Free Trial |
| Starting Price | |
| Tech used | |
| Tag | Software Development |
PlotCh.at Rank/Visit
| Global Rank | 10195414 |
| Country | |
| Month Visit | 988 |
Top 5 Countries
55.14%
44.86%
Turkey
Viet Nam
Traffic Sources
0%
0%
0%
0%
0%
0%
Social
Paid Referrals
Mail
Referrals
Search
Direct
Diagram.chat Rank/Visit
| Global Rank | 0 |
| Country | |
| Month Visit | 0 |
Top 5 Countries
39.98%
20.77%
17.15%
14.09%
8.01%
India
Mexico
China
Hong Kong
France
Traffic Sources
53.55%
46.45%
0%
Direct
Referrals
Search
What are some alternatives?
When comparing PlotCh.at and Diagram.chat, you can also consider the following products
Chat With Data - Powerful AI tool that lets you extract valuable insights and information from data files effortlessly
DataChat AI - DataChat is an all-in-one analytics platform for everyone. From AI-powered insights to stunning visualizations, DataChat can do it all.
TalktoData AI - TalktoData is the Advanced-Data Analytics mode of GPT-4. It works with Excel, CSV files and all the major SQL databases.
GraphMaker AI - Create a professional chart for free with the first AI-powered graph maker. Make custom bar charts, scatter plots, pie charts, histograms, and line charts in seconds.