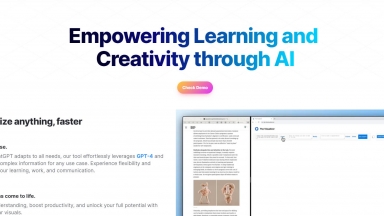
 The Visualizer
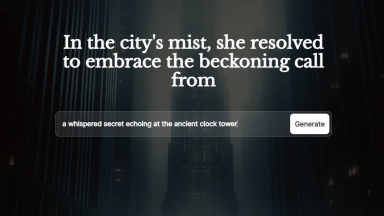
 Visuali
The Visualizer
| Launched | 2023 |
| Pricing Model | Free Trial |
| Starting Price | |
| Tech used | Framer,Gzip,HTTP/3,OpenGraph,HSTS |
| Tag | Data Visualization,Mind Mapping,Project Management |
Visuali
| Launched | 2022-07 |
| Pricing Model | Free Trial |
| Starting Price | |
| Tech used | Plausible Analytics,Express,OpenGraph,Nginx |
| Tag | Art Generators,Animation Generators |
The Visualizer Rank/Visit
| Global Rank | 12080034 |
| Country | United States |
| Month Visit | 1548 |
Top 5 Countries
Traffic Sources
Visuali Rank/Visit
| Global Rank | 2173188 |
| Country | United States |
| Month Visit | 8456 |
Top 5 Countries
Traffic Sources
Estimated traffic data from Similarweb
What are some alternatives?
VisualizeAI - VisualizeAI: The Ultimate AI-Based Design Visualization Tool. Build prototypes, visualize designs, and bring ideas to life in seconds.
VisualGPT - Your all-in-one AI platform for stunning images & designs. Generate, edit, & enhance photos, graphics, and art effortlessly. No design skills needed.
vizGPT - Generate precise visualizations from datasets effortlessly using GPT. Edit and refine the visualizations step by step, minimizing effort and time.
YVisuals - Effortlessly create and customize engaging visuals with YVisuals, a user-friendly AI-powered application. Perfect for teachers, founders, and consultants.