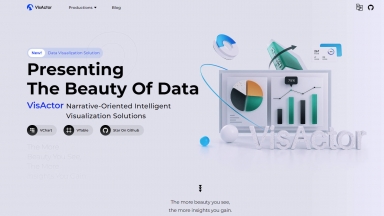
 VisActor
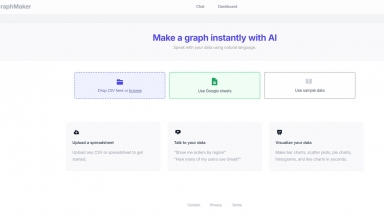
 GraphMaker AI
VisActor
| Launched | 2023-03 |
| Pricing Model | Free |
| Starting Price | |
| Tech used | Google Analytics,Google Tag Manager,Akamai |
| Tag | Data Visualization,Data Analysis |
GraphMaker AI
| Launched | 2023-04 |
| Pricing Model | Free Trial |
| Starting Price | |
| Tech used | Next.js,Vercel,Gzip,OpenGraph,Webpack,HSTS |
| Tag | Data Visualization,Data Analysis |
VisActor Rank/Visit
| Global Rank | 640836 |
| Country | China |
| Month Visit | 32759 |
Top 5 Countries
Traffic Sources
GraphMaker AI Rank/Visit
| Global Rank | 343657 |
| Country | India |
| Month Visit | 105121 |
Top 5 Countries
Traffic Sources
Estimated traffic data from Similarweb
What are some alternatives?
VisImagine - VisImagine instantly transforms scripts into AI storyboards & high-quality videos. Enjoy consistent characters, pro voiceovers, and rapid pre-production.
Vizzy - Presenting data in a meaningful and understandable way can be a challenge, especially for those unfamiliar with numbers and statistics – that's where Vizzy comes in, offering AI data interpretation.
VisQ - Effortlessly guide AI to automate and enhance tasks with our intuitive interface.No expertise needed, just clear results.
Virtualitics - Answers to business challenges live in your data—don’t limit your search. Virtualitics, Inc. helps organizations leverage all their data with Intelligent Data Exploration
Vison AI - Vison AI is the ultimate solution for individuals and businesses looking to enhance their marketing and operational endeavors.