 Text2Infographic
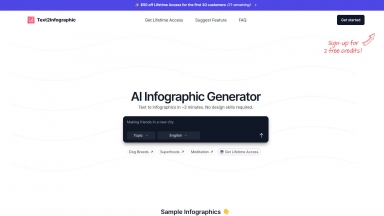
Text to Infographic は、あなたのブログ、ソーシャルメディアなどに、テキストを視覚化する AI インフォグラフィックジェネレーターです。
 Infography
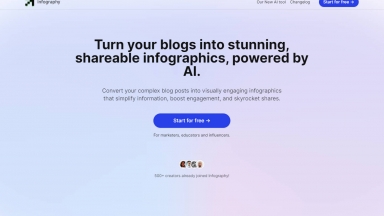
複雑なブログ記事をビジュアルに訴求力のあるインフォグラフィックに変換して、情報を簡略化し、エンゲージメントを高め、シェアを急上昇させましょう。
Text2Infographic
| Launched | 2024-05 |
| Pricing Model | Free Trial |
| Starting Price | |
| Tech used | Plausible Analytics,Next.js,Vercel,Gzip,OpenGraph,Webpack,HSTS |
| Tag | Text To Infographic,Data Visualization,Content Creation |
Infography
| Launched | 2024-02 |
| Pricing Model | Paid |
| Starting Price | $9.99 /month |
| Tech used | JSDelivr,unpkg,Google Fonts,Svelte(Kit),Vercel,Gzip,JSON Schema,OpenGraph,HSTS,YouTube |
| Tag | Text To Infographic,Content Creation,Social Media Marketing |
Text2Infographic Rank/Visit
| Global Rank | 600093 |
| Country | India |
| Month Visit | 56247 |
Top 5 Countries
11.04%
8.45%
7.81%
6.62%
5.24%
India
United States
Nigeria
Australia
Mexico
Traffic Sources
4.61%
0.9%
0.18%
13.68%
44.22%
36.33%
social
paidReferrals
mail
referrals
search
direct
Infography Rank/Visit
| Global Rank | 512679 |
| Country | India |
| Month Visit | 71736 |
Top 5 Countries
22.05%
11.36%
9.67%
8.53%
6.55%
India
Brazil
Colombia
Mexico
United States
Traffic Sources
4.22%
0.94%
0.34%
8.27%
40.92%
45.25%
social
paidReferrals
mail
referrals
search
direct
Estimated traffic data from Similarweb
What are some alternatives?
When comparing Text2Infographic and Infography, you can also consider the following products
GraphicInfo - AI搭載ツールで、記事から魅力的なインフォグラフィックを作成しましょう。
Visual Infograph AI Dash - 数分で魅力的なインフォグラフィックを作成しましょう!Visual Infograph AI Dashは、AIを活用してデータを変換します。レポート、プレゼンテーション、マーケティングに最適です。
Infografix - Infografix は AI を使用してさまざまなタイプのインフォグラフィックを作成する、無料のインフォグラフィック ジェネレーターです。デザインのスキルは不要です!
EzyGraph - EzyGraph:無料のAIインフォグラフィック作成ツール。記事やブログを、魅力的なビジュアルコンテンツに瞬時に変換。使いやすく、カスタマイズも容易。エンゲージメントを向上させます!