
What is Visual Infograph AI Dash?
Creating compelling infographics often means wrestling with complex design software or spending hours manually arranging data. Visual Infograph AI Dash offers a different approach. This tool uses artificial intelligence to help you transform your documents and data into clear, engaging, and shareable infographics quickly, letting you focus on the insights, not just the design process. If you need to communicate data visually for reports, presentations, or content marketing, this platform is built to simplify that task.
Key Features
📄 AI Document Analysis: Upload your data, currently supported via PDF files. The AI automatically reads and interprets the key information within your document, preparing it for visualization. (Support for additional file formats is planned).
🎨 Template Selection & Customization: Choose from a library of professionally designed infographic templates suited for various data types. You can easily adjust colors, fonts, and layouts to align with your brand or specific preferences.
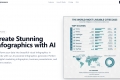
🤖 Instant AI Generation: Once your data is uploaded and a template is selected, the AI generates a complete infographic draft in seconds, translating complex information into an easy-to-understand visual format.
✍️ Natural Language Editing: Modify your generated infographic using simple text commands. Ask the AI to "change the background to light grey," "represent section 3 as a bar chart," or "summarize this paragraph with an icon." This intuitive process makes editing feel like a conversation.
💾 High-Quality Downloads: Export your finished infographic in high-quality formats suitable for web sharing, presentations, or print.
🗂️ Project Management: Revisit past projects anytime. You can continue editing, make changes based on new data, or regenerate visuals using different prompts or templates.
Use Cases
Visual Infograph AI Dash can be applied in various scenarios:
Content Marketing Enhancement: You've written a detailed blog post or whitepaper on "Effective Marketing Strategies" saved as a PDF. Upload it to Visual Infograph AI Dash, choose a vibrant template, and let the AI generate a shareable infographic summarizing the key strategies, perfect for social media promotion or inclusion in email newsletters.
Simplifying Business Reports: Your team has compiled a dense "Customer Engagement Analysis" report in PDF format. Instead of presenting pages of text and tables, use the platform to automatically create an infographic highlighting the core findings, trends, and key performance indicators, making the insights accessible to stakeholders at a glance.
Educational Material Creation: You need to explain a concept like the "5 Steps to Digital Marketing Success" from a PDF guide. Upload the document, select an appropriate template, and generate an easy-to-follow visual guide that breaks down the steps, making the information more digestible and memorable for students or trainees.
Conclusion
Visual Infograph AI Dash streamlines the process of turning your data-rich documents into visually appealing infographics. By leveraging AI for data analysis, generation, and intuitive editing, it significantly reduces the time and effort typically required. This allows you to communicate your insights more effectively, engage your audience better, and produce professional-looking visuals without needing deep design expertise. If you regularly work with data and need a faster way to create compelling visual stories, Visual Infograph AI Dash is worth exploring.

More information on Visual Infograph AI Dash
Launched
2025-04
Pricing Model
Paid
Starting Price
$15/month
Global Rank
Follow
Month Visit
<5k
Tech used
Microsoft Clarity,Cloudflare CDN,Google Fonts,Gzip,OpenGraph
Visual Infograph AI Dash was manually vetted by our editorial team and was first featured on 2025-05-01.
Visual Infograph AI Dash Alternatives
Load more Alternatives-

Create engaging Infographic from your articles with our AI-powered tool.
-
Piktochart AI transforms your ideas into stunning, on-brand infographics, reports & presentations in seconds. Design effortlessly with AI.
-

Text to Infographic is an AI Infographic Generator that turns your text into visuals for your blog, social media, and more.
-
Transform your data into beautiful visual infographics in seconds with our AI-powered infographics generator. Perfect for digital marketing infographics, business presentations, and content creation.
-
