 Infography
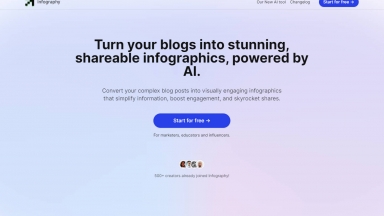
 EzyGraph
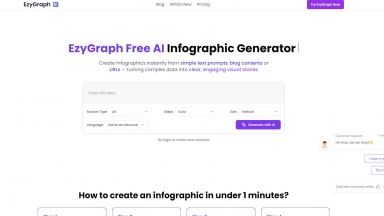
Infography
| Launched | 2024-02 |
| Pricing Model | Paid |
| Starting Price | $9.99 /month |
| Tech used | JSDelivr,unpkg,Google Fonts,Svelte(Kit),Vercel,Gzip,JSON Schema,OpenGraph,HSTS,YouTube |
| Tag | Text To Infographic,Content Creation,Social Media Marketing |
EzyGraph
| Launched | 2024-08 |
| Pricing Model | Freemium |
| Starting Price | $4.9/month |
| Tech used | Google Analytics,Cloudflare CDN,Next.js,Vercel,Gzip,HTTP/3,OpenGraph,Webpack,HSTS |
| Tag | Text To Infographic |
Infography Rank/Visit
| Global Rank | 512679 |
| Country | India |
| Month Visit | 71736 |
Top 5 Countries
22.05%
11.36%
9.67%
8.53%
6.55%
India
Brazil
Colombia
Mexico
United States
Traffic Sources
4.22%
0.94%
0.34%
8.27%
40.92%
45.25%
social
paidReferrals
mail
referrals
search
direct
EzyGraph Rank/Visit
| Global Rank | 3854600 |
| Country | Vietnam |
| Month Visit | 4949 |
Top 5 Countries
39.71%
30.45%
22.49%
3.4%
2.62%
Vietnam
India
United States
France
Singapore
Traffic Sources
7.9%
1.31%
0.12%
9.85%
41.62%
38.71%
social
paidReferrals
mail
referrals
search
direct
Estimated traffic data from Similarweb
What are some alternatives?
When comparing Infography and EzyGraph, you can also consider the following products
GraphicInfo - 使用我们的 AI 工具,从您的文章中创建引人入胜的信息图表。
Infogram - Infogram 是一款由 AI 驱动的工具,拥有可自定义的模板、互动内容和高级分析功能。它使用户能够为营销、教育和非营利组织创建令人惊叹的信息图表。在所有设备上无缝运行。
Text2Infographic - Text to Infographic 是一款人工智能图表生成器,可以将您的文本转换为博客、社交媒体等平台的视觉效果。
Infografix - Infografix 是免费信息图表生成器,它使用 AI 来创建多种类型的信息图表。无需设计技能!
Visual Infograph AI Dash - 几分钟内创建引人注目的信息图!Visual Infograph AI Dash 利用人工智能技术转换您的数据,是报告、演示和营销的理想之选。