 Text2Infographic
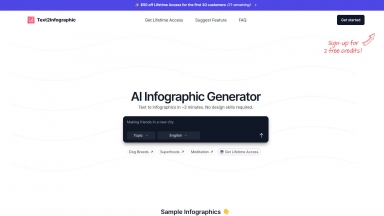
Text to Infographic 是一款人工智能图表生成器,可以将您的文本转换为博客、社交媒体等平台的视觉效果。
 GraphicInfo
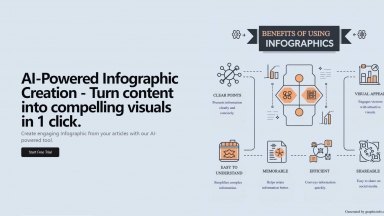
Text2Infographic
| Launched | 2024-05 |
| Pricing Model | Free Trial |
| Starting Price | |
| Tech used | Plausible Analytics,Next.js,Vercel,Gzip,OpenGraph,Webpack,HSTS |
| Tag | Text To Infographic,Data Visualization,Content Creation |
GraphicInfo
| Launched | 2024-07 |
| Pricing Model | Freemium |
| Starting Price | $11.99/Month |
| Tech used | Google Analytics,Google Tag Manager,Gzip,OpenGraph |
| Tag | Text To Infographic,Marketing Material Generators |
Text2Infographic Rank/Visit
| Global Rank | 600093 |
| Country | India |
| Month Visit | 56247 |
Top 5 Countries
11.04%
8.45%
7.81%
6.62%
5.24%
India
United States
Nigeria
Australia
Mexico
Traffic Sources
4.61%
0.9%
0.18%
13.68%
44.22%
36.33%
social
paidReferrals
mail
referrals
search
direct
GraphicInfo Rank/Visit
| Global Rank | 3778117 |
| Country | Vietnam |
| Month Visit | 5289 |
Top 5 Countries
42.28%
39.27%
15.55%
2.91%
Vietnam
India
United States
Brazil
Traffic Sources
4.29%
0.96%
0.07%
29.17%
38.07%
27.22%
social
paidReferrals
mail
referrals
search
direct
Estimated traffic data from Similarweb
What are some alternatives?
When comparing Text2Infographic and GraphicInfo, you can also consider the following products
Visual Infograph AI Dash - 几分钟内创建引人注目的信息图!Visual Infograph AI Dash 利用人工智能技术转换您的数据,是报告、演示和营销的理想之选。
Infografix - Infografix 是免费信息图表生成器,它使用 AI 来创建多种类型的信息图表。无需设计技能!
Infography - 将您复杂的博客文章转换成引人入胜的信息图表,简化信息,提高参与度,并大幅提升分享率。
EzyGraph - EzyGraph:免费 AI 信息图制作工具。即刻将文章和博客转化为引人入胜的视觉内容。简单易用,高度自定义。 显著提升互动率!