 Text2Infographic
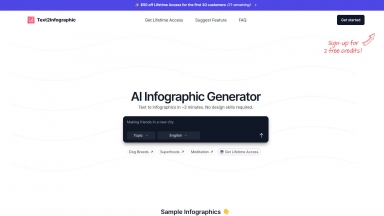
Text to Infographic 是一款人工智能图表生成器,可以将您的文本转换为博客、社交媒体等平台的视觉效果。
 MidVector
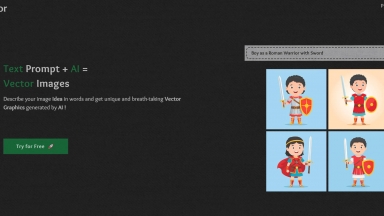
使用 Text to Vector Images AI 轻松创建视觉上引人入胜的图形。利用用户友好的界面将文本转换为令人惊艳的矢量图像。
Text2Infographic
| Launched | 2024-05 |
| Pricing Model | Free Trial |
| Starting Price | |
| Tech used | Plausible Analytics,Next.js,Vercel,Gzip,OpenGraph,Webpack,HSTS |
| Tag | Text To Infographic,Data Visualization,Content Creation |
MidVector
| Launched | 2023-1 |
| Pricing Model | Free Trial |
| Starting Price | |
| Tech used | Gzip,HTTP/3,Progressive Web App,HSTS |
| Tag | Text To Image,Image Generators |
Text2Infographic Rank/Visit
| Global Rank | 600093 |
| Country | India |
| Month Visit | 56247 |
Top 5 Countries
11.04%
8.45%
7.81%
6.62%
5.24%
India
United States
Nigeria
Australia
Mexico
Traffic Sources
4.61%
0.9%
0.18%
13.68%
44.22%
36.33%
social
paidReferrals
mail
referrals
search
direct
MidVector Rank/Visit
| Global Rank | 0 |
| Country | Thailand |
| Month Visit | 339 |
Top 5 Countries
100%
Thailand
Traffic Sources
4.99%
1.05%
0.29%
13.36%
46.46%
32.69%
social
paidReferrals
mail
referrals
search
direct
Estimated traffic data from Similarweb
What are some alternatives?
When comparing Text2Infographic and MidVector, you can also consider the following products
GraphicInfo - 使用我们的 AI 工具,从您的文章中创建引人入胜的信息图表。
Visual Infograph AI Dash - 几分钟内创建引人注目的信息图!Visual Infograph AI Dash 利用人工智能技术转换您的数据,是报告、演示和营销的理想之选。
Infografix - Infografix 是免费信息图表生成器,它使用 AI 来创建多种类型的信息图表。无需设计技能!
Infography - 将您复杂的博客文章转换成引人入胜的信息图表,简化信息,提高参与度,并大幅提升分享率。
EzyGraph - EzyGraph:免费 AI 信息图制作工具。即刻将文章和博客转化为引人入胜的视觉内容。简单易用,高度自定义。 显著提升互动率!