 Textomap
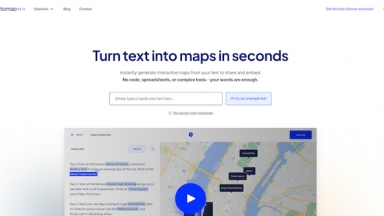
 Text2Infographic
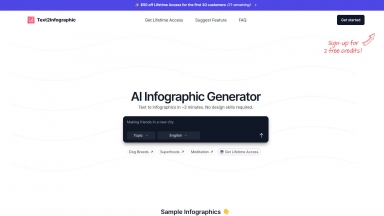
Text to Infographic 是一款 AI 圖表生成器,可以將您的文字轉換成視覺化內容,適用於您的部落格、社群媒體等等。
Textomap
| Launched | 2020-12 |
| Pricing Model | Freemium |
| Starting Price | Pro $7/mo |
| Tech used | Google Ads,Google Analytics,Google Tag Manager,Microsoft Clarity,Sign in with Google,Bootstrap,jQuery UI,PHP,Apache |
| Tag | Data Visualization |
Text2Infographic
| Launched | 2024-05 |
| Pricing Model | Free Trial |
| Starting Price | |
| Tech used | Plausible Analytics,Next.js,Vercel,Gzip,OpenGraph,Webpack,HSTS |
| Tag | Text To Infographic,Data Visualization,Content Creation |
Textomap Rank/Visit
| Global Rank | 1553488 |
| Country | United States |
| Month Visit | 12135 |
Top 5 Countries
39.98%
16.56%
12.5%
11.83%
6.36%
United States
France
India
Germany
Vietnam
Traffic Sources
6.15%
0.98%
0.1%
8.22%
43.47%
40.87%
social
paidReferrals
mail
referrals
search
direct
Text2Infographic Rank/Visit
| Global Rank | 600093 |
| Country | India |
| Month Visit | 56247 |
Top 5 Countries
11.04%
8.45%
7.81%
6.62%
5.24%
India
United States
Nigeria
Australia
Mexico
Traffic Sources
4.61%
0.9%
0.18%
13.68%
44.22%
36.33%
social
paidReferrals
mail
referrals
search
direct
Estimated traffic data from Similarweb
What are some alternatives?
When comparing Textomap and Text2Infographic, you can also consider the following products
MapStory - MapStory 是一個強大的工具,可讓您建立互動式地圖故事,例如旅遊部落格、美食部落格、地圖式活動等。您可以按步驟指南,或使用 AI 技術自動產生地圖故事。
Ultimaps - Ultimaps 是一款基於網路的工具,簡化了地圖製作流程。您可以匯入數據或使用 AI。自訂、分享和嵌入地圖。非常適合教育、商業和新聞工作者使用。無需編碼。
mymap.ai - 運用 MyMap.AI 這款 AI 驅動的工具,簡化您的創意流程。透過其友善的聊天介面,輕鬆建立、整理和分享您的想法。
Map This - 將你的 PDF 檔案轉換成心智圖,簡化你的學習歷程,並透過將濃縮的 PDF 文件轉換成視覺上吸睛、易於瀏覽的心智圖,來加強資訊保留能力。