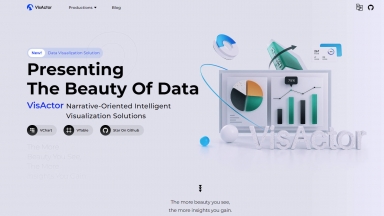
 VisActor

運用 VisActor 這款智慧視覺化解決方案,將數據轉變為引人入勝的故事。使用 VChart Story Teller、VTable Checkered Artist 和 VGrammar Data Magician,創造視覺上令人驚豔的圖表並獲得寶貴的洞察。非常適合大螢幕視覺化、商業智慧和資訊管理。
 PlotCh.at

與資料對話的 PlotChat:上傳情節圖像、產生資料表格,並取得基於問題的說明。藉助這個強大的 AI 工具,簡化資料解讀並獲得深入見解。
VisActor
| Launched | 2023-03 |
| Pricing Model | Free |
| Starting Price | |
| Tech used | Google Analytics,Google Tag Manager,Akamai |
| Tag | Data Visualization,Data Analysis |
PlotCh.at
| Launched | 2024 |
| Pricing Model | Freemium |
| Starting Price | |
| Tech used | Next.js,Vercel,Gzip,Webpack,HSTS |
| Tag | Data Visualization,Data Analysis |
VisActor Rank/Visit
| Global Rank | 640836 |
| Country | China |
| Month Visit | 32759 |
Top 5 Countries
71.1%
6.67%
6.13%
5.75%
3.16%
China
Singapore
Hong Kong
United States
Vietnam
Traffic Sources
1.19%
0.28%
0.04%
19.27%
19.09%
60.08%
social
paidReferrals
mail
referrals
search
direct
PlotCh.at Rank/Visit
| Global Rank | 11565040 |
| Country | United States |
| Month Visit | 1201 |
Top 5 Countries
100%
United States
Traffic Sources
41.59%
36.6%
11.96%
7.98%
0.83%
0.19%
Direct
Search
Referrals
Social
Paid Referrals
Mail
Estimated traffic data from Similarweb
What are some alternatives?
When comparing VisActor and PlotCh.at, you can also consider the following products
VisImagine - VisImagine instantly transforms scripts into AI storyboards & high-quality videos. Enjoy consistent characters, pro voiceovers, and rapid pre-production.
Vizzy - 以有意義且易於理解的方式呈現數據是一項挑戰,特別是對於不熟悉數字和統計數據的人來說,這就是 Vizzy 派上用場的地方,提供 AI 數據解讀。
VisQ - 透過我們的直觀介面輕易引導 AI 自動化並增強任務,無需專業知識,即可獲得清晰的結果。
Virtualitics - 企業挑戰的解答就在您的資料之中,不要限制您的搜尋範圍。Virtualitics, Inc. 協助企業運用智慧型資料探勘技術,善用所有資料
Vison AI - Vison AI 是個人和企業提升行銷和營運工作的終極解決方案。