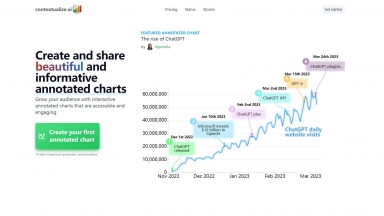
 Contextualize.ai
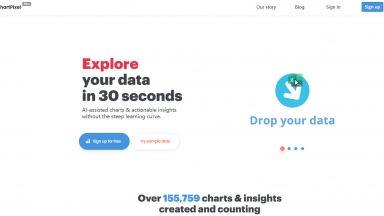
 ChartPixel
Contextualize.ai
| Launched | 2019-08 |
| Pricing Model | Freemium |
| Starting Price | $9 per month |
| Tech used | Next.js,Vercel,Gravatar,Webpack,HSTS |
| Tag | Data Analysis,Data Visualization |
ChartPixel
| Launched | 2020-12 |
| Pricing Model | Freemium |
| Starting Price | |
| Tech used | cdnjs,Cloudflare CDN,JSDelivr,Google Fonts,Bootstrap,jQuery,Gzip,JSON Schema,OpenGraph,HSTS |
| Tag | Data Visualization,Data Analysis |
Contextualize.ai Rank/Visit
| Global Rank | 10265081 |
| Country | United States |
| Month Visit | 229 |
Top 5 Countries
Traffic Sources
ChartPixel Rank/Visit
| Global Rank | 1574981 |
| Country | India |
| Month Visit | 16627 |
Top 5 Countries
Traffic Sources
Estimated traffic data from Similarweb
What are some alternatives?
Context.ai - Context: Secure AI suite turns scattered data from all your apps into polished presentations, spreadsheets, & documents, on-brand.
ChartGen.ai - Turn your data into stunning, professional charts in seconds. Just upload your data, describe what you need, and watch the magic happen.
Graphy - Graphy's AI transforms messy data into professional, insightful graphs in seconds. Create clear, presentation-ready visuals for faster decisions & powerful communication.
Chart AI - Chart AI is an app that leverages artificial intelligence toprovide you with a detailed analysis on any trading chart,whether it be forex, crypto or stocks.