
What is Contextualize.ai?
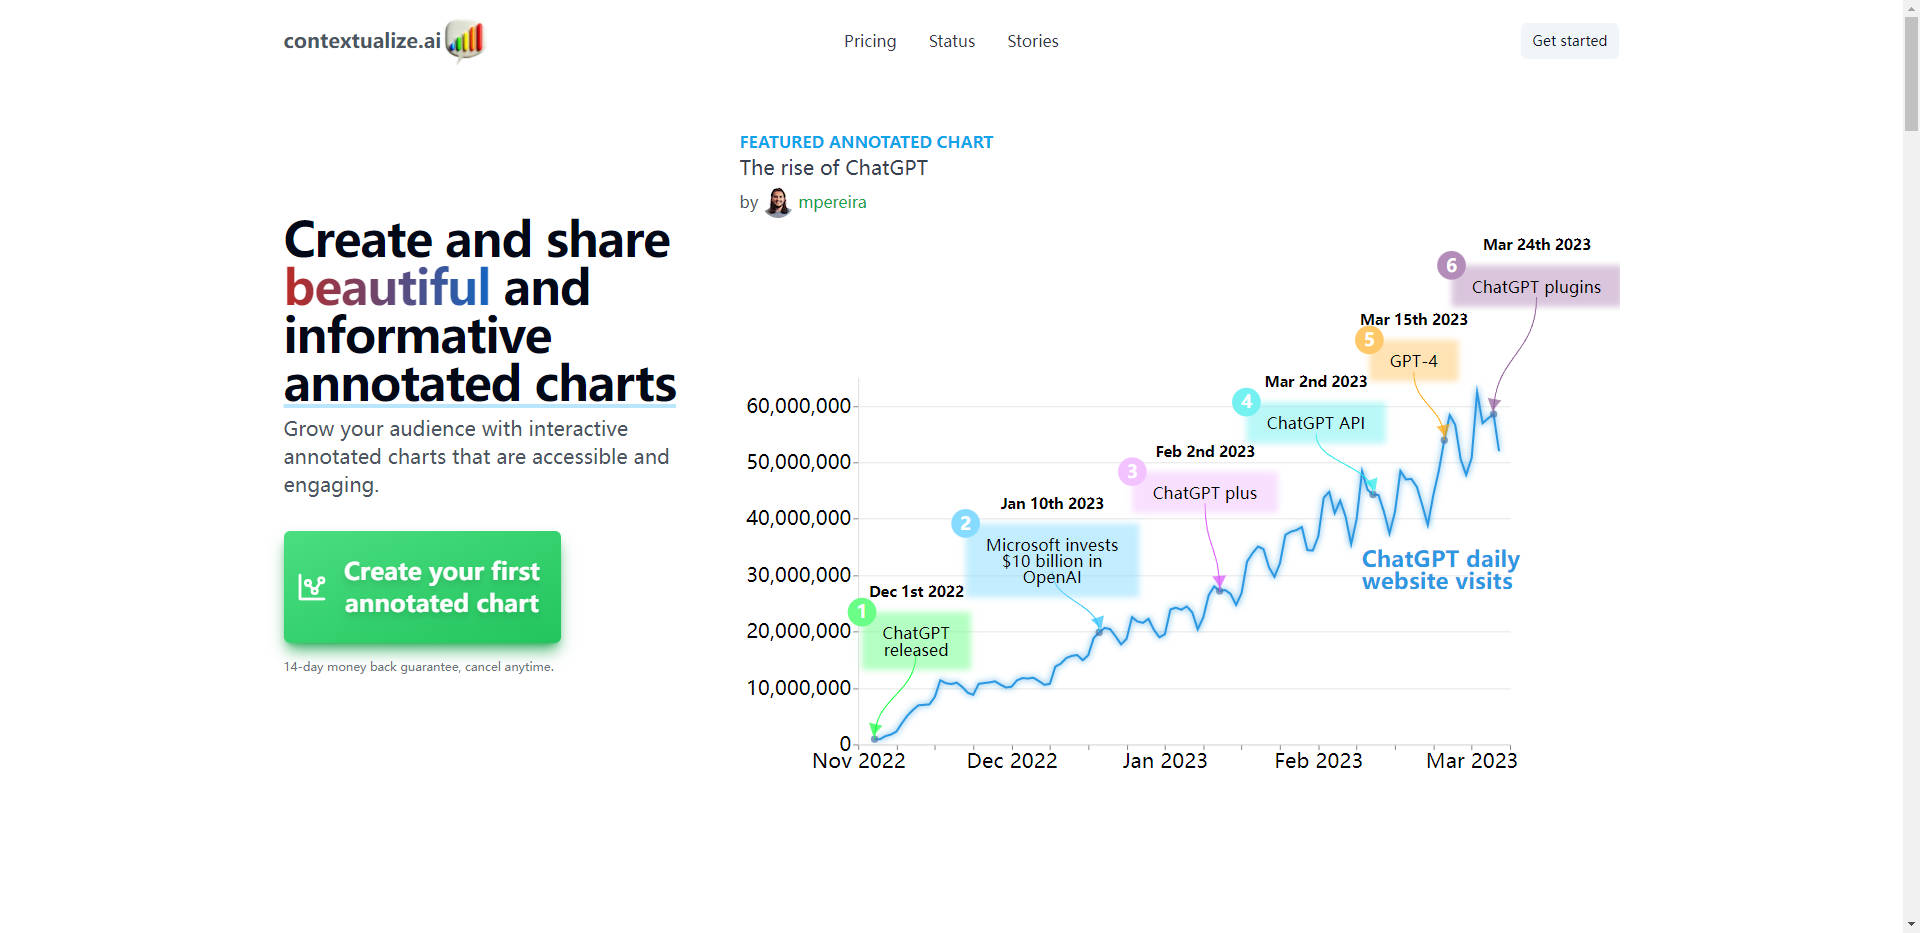
Contextualize.ai empowers users to create and share captivating annotated charts effortlessly. With intuitive tools, it's now simple to contextualize data, grow audiences, and craft compelling narratives without any coding required. Enjoy a risk-free experience with a 30-day money-back guarantee.
Key Features:
1️⃣ Interactive Chart Creation: Generate beautiful and informative charts in minutes, not days, with no coding necessary.
2️⃣ Annotate with Ease: Highlight important events or periods directly on your charts, adding depth and insight to your data story.
3️⃣ Storytelling Made Simple: Share engaging narratives with data, whether it's for presentations, articles, or social media, effortlessly contextualizing your information.
Use Cases:
Data-Driven Presentations: Impress your audience with visually appealing charts annotated with key insights, enhancing understanding and engagement.
Informative Articles: Enrich your articles with interactive charts that provide context and depth to your analysis, making complex data accessible to all readers.
Social Media Storytelling: Capture attention on social platforms by sharing annotated charts that tell compelling stories at a glance, driving audience interaction and interest.
Conclusion:
Unlock the power of data storytelling with Contextualize.ai. Whether you're a seasoned data analyst or a beginner, our intuitive platform empowers you to communicate effectively through visualizations. Join us today and start crafting your own captivating data stories. With our 30-day money-back guarantee, there's no risk—only endless possibilities to transform your data into compelling narratives. Start your journey now and discover how Contextualize.ai can streamline your data communication process.
More information on Contextualize.ai
Launched
2019-08
Pricing Model
Freemium
Starting Price
$9 per month
Global Rank
10265081
Follow
Month Visit
<5k
Tech used
Next.js,Vercel,Gravatar,Webpack,HSTS
Top 5 Countries
100%
United States
Traffic Sources
9.64%
1.27%
0.19%
12.66%
33.58%
41.83%
social
paidReferrals
mail
referrals
search
direct
Source: Similarweb (Sep 24, 2025)
Contextualize.ai was manually vetted by our editorial team and was first featured on 2023-08-14.
Related Searches
Contextualize.ai Alternatives
Load more Alternatives-

Context: Secure AI suite turns scattered data from all your apps into polished presentations, spreadsheets, & documents, on-brand.
-
ChartPixel: Turn messy data into secure AI insights & interactive charts. Chat with your data, get clear explanations. No coding or data science needed.
-
Turn your data into stunning, professional charts in seconds. Just upload your data, describe what you need, and watch the magic happen.
-

-
