 GraphMaker AI
 Diagramming AI
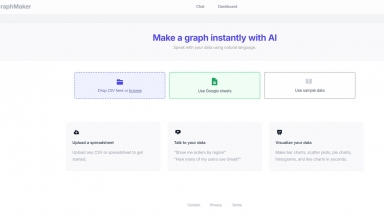
GraphMaker AI
| Launched | 2023-04 |
| Pricing Model | Free Trial |
| Starting Price | |
| Tech used | Next.js,Vercel,Gzip,OpenGraph,Webpack,HSTS |
| Tag | Data Visualization,Data Analysis |
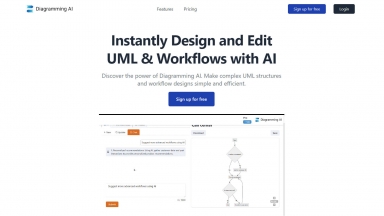
Diagramming AI
| Launched | 2023-08 |
| Pricing Model | Free Trial |
| Starting Price | $6/month |
| Tech used | Google Analytics,Google Tag Manager,Next.js,Vercel,Emotion,Webpack,HSTS |
| Tag | Drawing,Project Management,Software Development |
GraphMaker AI Rank/Visit
| Global Rank | 343657 |
| Country | India |
| Month Visit | 105121 |
Top 5 Countries
Traffic Sources
Diagramming AI Rank/Visit
| Global Rank | 438829 |
| Country | India |
| Month Visit | 81940 |
Top 5 Countries
Traffic Sources
Estimated traffic data from Similarweb
What are some alternatives?
Viz Graph Maker - AI Graph Maker simplifies data viz. Create stunning graphs in clicks with AI. Responsive, customizable, multi-format export. Ideal for pros & beginners.
ChartGen.ai - Turn your data into stunning, professional charts in seconds. Just upload your data, describe what you need, and watch the magic happen.
Graphy - Graphy's AI transforms messy data into professional, insightful graphs in seconds. Create clear, presentation-ready visuals for faster decisions & powerful communication.
Grapha.ai - Uncover hidden trends and patterns in your data effortlessly. Harness the power of AI with your data science copilot, turning complex data into clear insights.
Line graph maker - Line Graph Maker - Easily create custom line charts. Adjust axes, colors, tension. Download in JPG, PNG, SVG. Ideal for students, business, research. User-friendly!