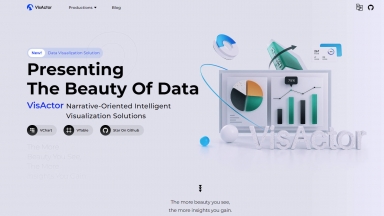
 VisActor

Transform your data into compelling stories with VisActor, an intelligent visualization solution. Create visually stunning charts and gain valuable insights with VChart Story Teller, VTable Checkered Artist, and VGrammar Data Magician. Perfect for large screen visualization, business intelligence, and information management.
 Vizly
Vizly

Supercharge your data analysis and visualization with Vizly, an AI tool that automates insights and builds intuitive dashboards. Try it now!
VisActor
| Launched | 2023-03-13 |
| Pricing Model | Free |
| Starting Price | |
| Tech used | |
| Tag | Data Analysis,Data visualization |
Vizly
| Launched | 2023-04-18 |
| Pricing Model | Freemium |
| Starting Price | $40/month |
| Tech used | Cloudflare CDN,Next.js,Emotion,Gzip,HTTP/3,OpenGraph,Webpack |
| Tag | Data visualization |
VisActor Rank/Visit
| Global Rank | 1373080 |
| Country | China |
| Month Visit | 16718 |
Top 5 Countries
81.04%
6.83%
4.22%
3.03%
1.52%
China
Korea, Republic of
United States
Hong Kong
Singapore
Traffic Sources
73.54%
22.87%
1.99%
1.6%
Direct
Referrals
Search
Social
Vizly Rank/Visit
| Global Rank | 1696155 |
| Country | United States |
| Month Visit | 22507 |
Top 5 Countries
72.72%
10.47%
6.4%
2.38%
1.85%
United States
Albania
Germany
Japan
United Kingdom
Traffic Sources
79.33%
14.54%
5.37%
0.76%
Direct
Search
Referrals
Social
What are some alternatives?
When comparing VisActor and Vizly, you can also consider the following products
The Visualizer - Enhance learning and creativity with the Visualizer. AI-powered visual maps simplify complex topics for students and lifelong learners.
GraphMaker AI - Create a professional chart for free with the first AI-powered graph maker. Make custom bar charts, scatter plots, pie charts, histograms, and line charts in seconds.
Vizzy - Presenting data in a meaningful and understandable way can be a challenge, especially for those unfamiliar with numbers and statistics – that's where Vizzy comes in, offering AI data interpretation.
PlotCh.at - Talk With Data's PlotChat: Upload plot images, generate data tables, and get question-based explanations. Simplify data interpretation and gain insights with this powerful AI tool.