 Visme
Visme
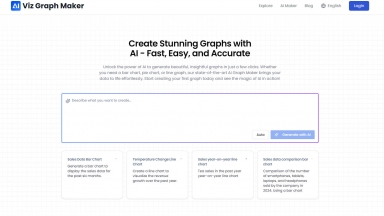
 Viz Graph Maker
Visme
| Launched | 2014-1 |
| Pricing Model | Freemium |
| Starting Price | $29.00 /month |
| Tech used | Google Analytics,Google Tag Manager,HubSpot Analytics,LinkedIn Insights,Cloudflare CDN,WordPress,Bootstrap,jQuery,Gzip,JSON Schema,LiteSpeed Cache,OpenGraph,Progressive Web App,HSTS,Apple App Banner |
| Tag | Presentation Maker,Data Visualization,Marketing Material Generators |
Viz Graph Maker
| Launched | 2024-11 |
| Pricing Model | Freemium |
| Starting Price | |
| Tech used | Cloudflare CDN,Google Fonts,Gzip,HTTP/3,OpenGraph,HSTS |
| Tag | Data Visualization,Invitation Maker,Certificate Maker |
Visme Rank/Visit
| Global Rank | 29883 |
| Country | United States |
| Month Visit | 1643932 |
Top 5 Countries
Traffic Sources
Viz Graph Maker Rank/Visit
| Global Rank | 717337 |
| Country | United States |
| Month Visit | 46600 |
Top 5 Countries
Traffic Sources
Estimated traffic data from Similarweb
What are some alternatives?
Vdraw.ai - VDraw: An AI - powered tool that turns text, files, or videos into stunning infographics. No design skills needed. Customize with fonts, colors, icons. Share easily.
Venngage - Venngage: Create professional infographics, reports & visuals easily with AI-powered tools, 10k+ templates & accessibility.
Vizzy - Presenting data in a meaningful and understandable way can be a challenge, especially for those unfamiliar with numbers and statistics – that's where Vizzy comes in, offering AI data interpretation.
Visily AI - Create stunning software wireframes & prototypes from hand-drawn sketches, app screenshots, built-in templates, and soon, text prompts.
YVisuals - Effortlessly create and customize engaging visuals with YVisuals, a user-friendly AI-powered application. Perfect for teachers, founders, and consultants.