
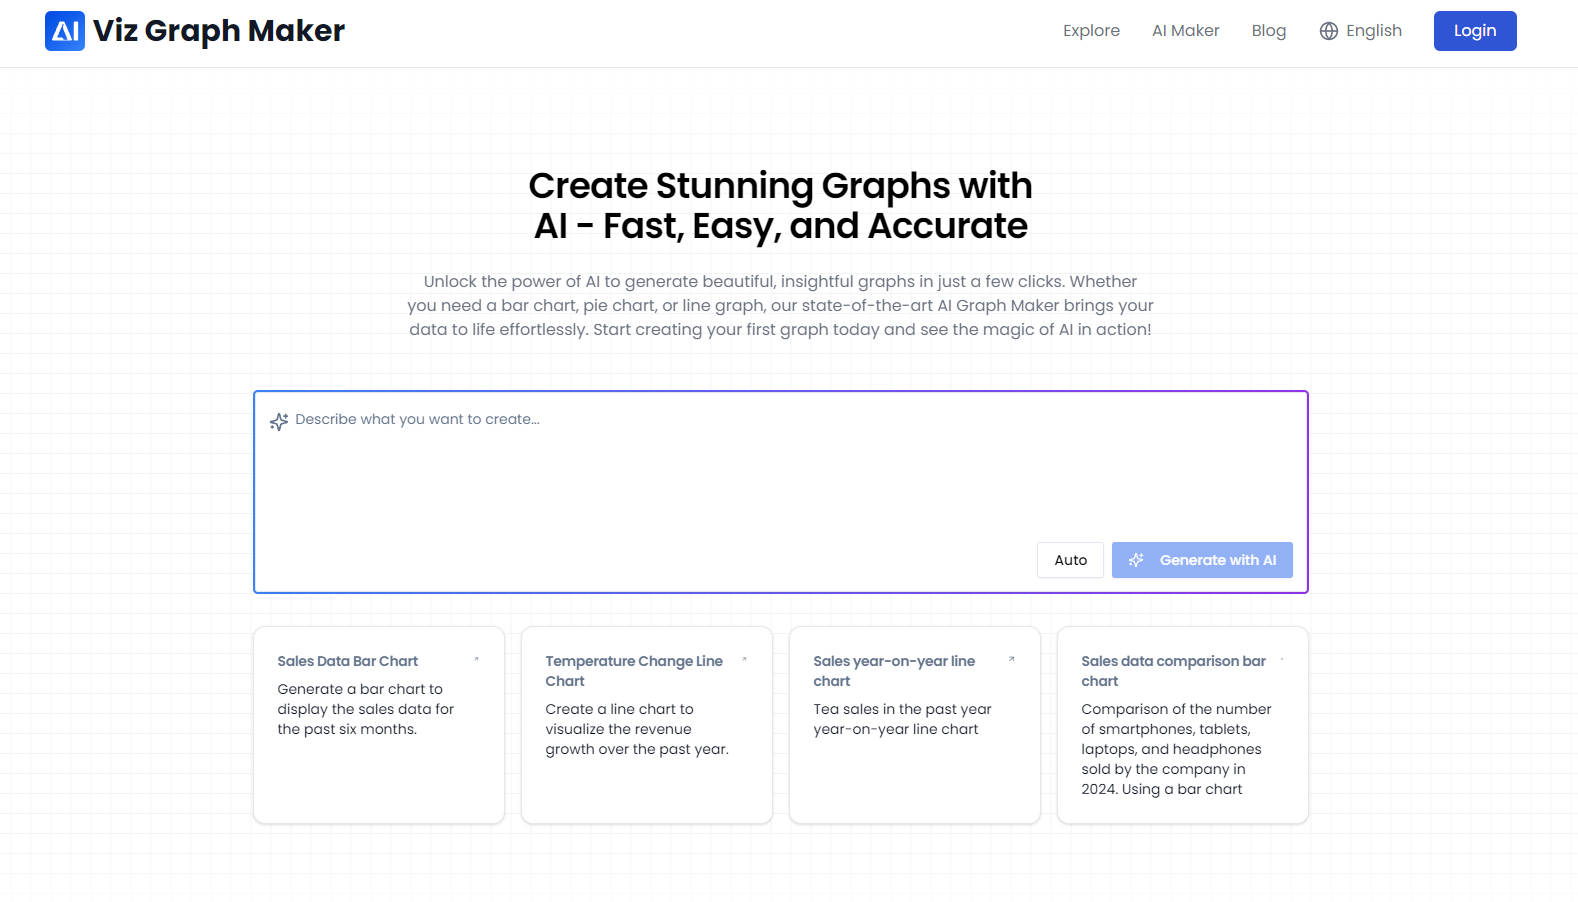
What is Viz Graph Maker?
AI Graph Maker revolutionizes data visualization by allowing you to create stunning graphs, charts, and diagrams in just a few clicks. Powered by artificial intelligence, this tool transforms raw data into insightful visual representations, making it easier than ever to convey information accurately and beautifully. Whether you're a professional data analyst or a beginner, AI Graph Maker simplifies the process, offering a wide range of chart types, customizable designs, and seamless export options.
Key Features:
📱 Responsive Design
Access and use AI Graph Maker on any device—desktop, tablet, or smartphone—without compromising functionality or ease of use.🤖 AI-Generated Graphs
Let the AI handle the heavy lifting. Input your data and watch as the tool autonomously creates accurate and visually appealing graphs in seconds.🎨 Visual Adjustment & Customization
Tailor your graphs with custom colors, fonts, and styles. Whether you want to tweak data points or overhaul the entire design, the intuitive interface makes it easy.📤 Multi-format Export
Export your graphs in multiple formats like PNG, SVG, and Mermaid for seamless integration into reports, presentations, or other tools.📊 Chart Diversity
Choose from a wide variety of chart types, including bar charts, pie charts, line graphs, flowcharts, and mind maps, to best represent your data.
Use Cases:
Marketing Analysis
A marketing manager needs to present sales data from the past year. Using AI Graph Maker, they quickly generate a year-on-year line chart that clearly illustrates revenue growth, helping stakeholders visualize trends and make informed decisions.Academic Research
A researcher is working on a study about climate change. They use AI Graph Maker to create a line chart that visualizes temperature changes over the past decade, making it easier to showcase their findings in an upcoming conference.Project Management
A project manager needs to outline the timeline for an upcoming product launch. With AI Graph Maker, they create a Gantt chart that breaks down each phase of the project, helping the team stay on track and meet deadlines.
Conclusion:
AI Graph Maker is the ultimate tool for anyone looking to transform complex data into clear, engaging visualizations. With its AI-driven automation, customizable options, and multi-format export capabilities, this tool is perfect for professionals and beginners alike. Say goodbye to the hassle of manual graph creation and let AI Graph Maker do the work for you.
More information on Viz Graph Maker
Launched
2024-11
Pricing Model
Freemium
Starting Price
Global Rank
717337
Follow
Month Visit
46.6K
Tech used
Cloudflare CDN,Google Fonts,Gzip,HTTP/3,OpenGraph,HSTS
Top 5 Countries
15.88%
12.94%
4.66%
3.54%
3%
United States
Russia
India
United Kingdom
Peru
Traffic Sources
4.75%
0.95%
0.15%
11.28%
52.19%
30.54%
social
paidReferrals
mail
referrals
search
direct
Source: Similarweb (Sep 25, 2025)
Viz Graph Maker was manually vetted by our editorial team and was first featured on 2024-12-26.
Related Searches
Viz Graph Maker Alternatives
Load more Alternatives-
Create a professional chart for free with the first AI-powered graph maker. Make custom bar charts, scatter plots, pie charts, histograms, and line charts in seconds.
-

-
-
Turn your data into stunning, professional charts in seconds. Just upload your data, describe what you need, and watch the magic happen.
-
