 Viz Graph Maker
 Piktochart
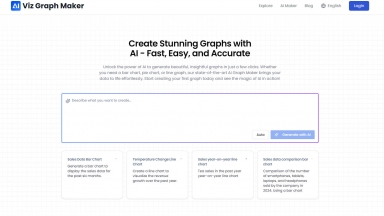
Viz Graph Maker
| Launched | 2024-11 |
| Pricing Model | Freemium |
| Starting Price | |
| Tech used | Cloudflare CDN,Google Fonts,Gzip,HTTP/3,OpenGraph,HSTS |
| Tag | Data Visualization,Invitation Maker,Certificate Maker |
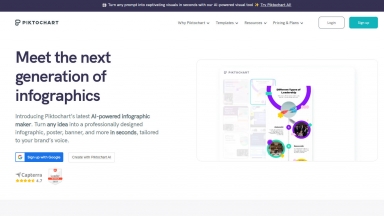
Piktochart
| Launched | 2011-6 |
| Pricing Model | Freemium |
| Starting Price | |
| Tech used | Google Tag Manager,Sign in with Google,Cloudflare CDN,WordPress,OneTrust,Bootstrap,jQuery,Gzip,JSON Schema,LiteSpeed Cache,OpenGraph,PHP,Amazon AWS S3 |
| Tag | Text To Infographic,Presentation Maker,Data Visualization |
Viz Graph Maker Rank/Visit
| Global Rank | 717337 |
| Country | United States |
| Month Visit | 46600 |
Top 5 Countries
Traffic Sources
Piktochart Rank/Visit
| Global Rank | 32193 |
| Country | United States |
| Month Visit | 1460931 |
Top 5 Countries
Traffic Sources
Estimated traffic data from Similarweb
What are some alternatives?
GraphMaker AI - Create a professional chart for free with the first AI-powered graph maker. Make custom bar charts, scatter plots, pie charts, histograms, and line charts in seconds.
Graphy - Graphy's AI transforms messy data into professional, insightful graphs in seconds. Create clear, presentation-ready visuals for faster decisions & powerful communication.
Grapha.ai - Uncover hidden trends and patterns in your data effortlessly. Harness the power of AI with your data science copilot, turning complex data into clear insights.
ChartGen.ai - Turn your data into stunning, professional charts in seconds. Just upload your data, describe what you need, and watch the magic happen.
aiflowchart.io - Using AI Flowchart you can save hours each week creating diagrams.