What is Databox?
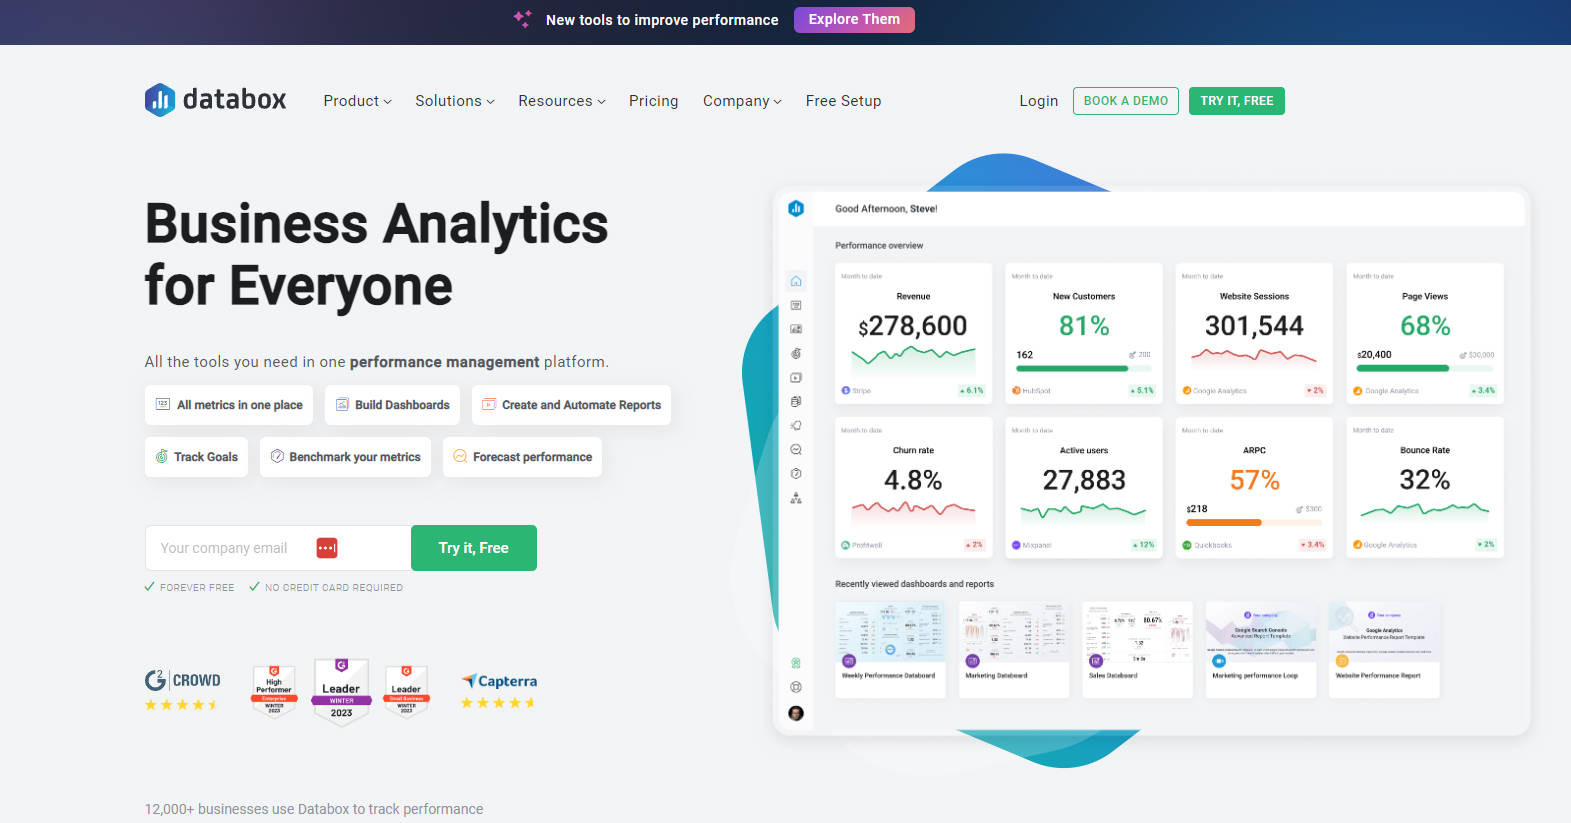
Databox Analytics is a performance management platform that provides all the necessary tools for business analytics in one place. It offers a wide range of features, including the ability to build dashboards, automate reports, track goals, benchmark metrics, and forecast performance. With its advanced features and AI-driven capabilities, Databox allows users to make data-informed decisions more easily and transform the way they track and leverage data.
Key Features:
1. Build Dashboards: Databox allows users to create customized dashboards without the need for coding or design skills. Users can pull the metrics they need and visualize key performance indicators (KPIs) in various ways. This feature enables users to have a comprehensive view of their performance at a glance.
2. Automate Reports: With Databox, users can automate the process of generating reports. They can set up scheduled reports to be sent to their team members, saving time and effort. This feature ensures that everyone stays updated on the latest performance metrics without manual intervention.
3. Track Goals: Databox enables users to set and measure progress towards their goals. Users can define specific targets and track their performance in real-time. This feature helps businesses stay focused and aligned with their objectives, ensuring continuous improvement.
Use Cases:
1. Performance Tracking: Databox is ideal for businesses that want to track and visualize their performance metrics easily. It allows users to connect various data sources and consolidate all the relevant metrics in one place. This makes it convenient for businesses to monitor their performance and identify areas for improvement.
2. Competitive Analysis: Databox offers benchmarking capabilities that allow users to compare their company's performance against similar businesses. This feature helps businesses identify high-growth opportunities and develop effective competitive strategies. By understanding how they stack up against their competitors, businesses can become leaders in their market.
3. Data Visualization: Databox simplifies the process of visualizing data by providing pre-built visualizations for popular metrics. Users can mix and match metrics from different sources in one dashboard, gaining a comprehensive view of their performance. This feature saves time and effort, allowing users to focus on analyzing the data and taking action.
Conclusion:
Databox Analytics is a powerful tool that provides businesses with all the necessary features for effective business analytics. Its ability to build customized dashboards, automate reports, track goals, and benchmark metrics makes it a valuable asset for businesses of all sizes. By leveraging Databox's advanced features and AI-driven capabilities, businesses can make data-informed decisions and unlock valuable insights. With over 12,000 businesses already using Databox, it is clear that this platform is transforming the way businesses track and leverage data. Start using Databox today and join the ranks of innovative businesses that are achieving success through data-driven decision-making.
More information on Databox
Launched
2000-8
Pricing Model
Freemium
Starting Price
Global Rank
98853
Follow
Month Visit
338.7K
Tech used
Google Tag Manager,cdnjs,WordPress,Google Fonts,jQuery,Gzip,JSON Schema,OpenGraph,Progressive Web App,Nginx,Intercom
Top 5 Countries
23.47%
6.25%
5.33%
4.46%
4.34%
United States
Poland
Netherlands
United Kingdom
Spain
Traffic Sources
2.62%
0.76%
0.12%
6.71%
46.31%
43.48%
social
paidReferrals
mail
referrals
search
direct
Source: Similarweb (Sep 24, 2025)
Databox was manually vetted by our editorial team and was first featured on 2024-01-02.
Related Searches