 Visual Infograph AI Dash
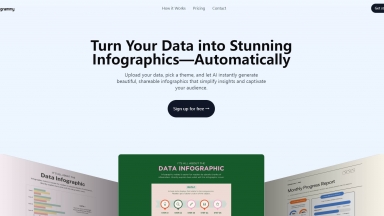
数分で魅力的なインフォグラフィックを作成しましょう!Visual Infograph AI Dashは、AIを活用してデータを変換します。レポート、プレゼンテーション、マーケティングに最適です。
 Piktochart
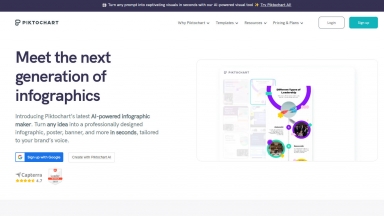
Piktochart AIを使えば、あなたのアイデアが、目を引くブランドイメージに沿ったインフォグラフィック、レポート、プレゼンテーションへとわずか数秒で生まれ変わります。AIが、デザイン作業を驚くほど簡単にします。
Visual Infograph AI Dash
| Launched | 2025-04 |
| Pricing Model | Paid |
| Starting Price | $15/month |
| Tech used | Microsoft Clarity,Cloudflare CDN,Google Fonts,Gzip,OpenGraph |
| Tag | Visual Design |
Piktochart
| Launched | 2011-6 |
| Pricing Model | Freemium |
| Starting Price | |
| Tech used | Google Tag Manager,Sign in with Google,Cloudflare CDN,WordPress,OneTrust,Bootstrap,jQuery,Gzip,JSON Schema,LiteSpeed Cache,OpenGraph,PHP,Amazon AWS S3 |
| Tag | Text To Infographic,Presentation Maker,Data Visualization |
Visual Infograph AI Dash Rank/Visit
| Global Rank | |
| Country | |
| Month Visit |
Top 5 Countries
Traffic Sources
Piktochart Rank/Visit
| Global Rank | 32193 |
| Country | United States |
| Month Visit | 1460931 |
Top 5 Countries
15.76%
9.37%
7.11%
5.29%
3.78%
United States
India
Mexico
Colombia
Peru
Traffic Sources
1.06%
0.43%
0.07%
4.62%
64.36%
29.46%
social
paidReferrals
mail
referrals
search
direct
Estimated traffic data from Similarweb
What are some alternatives?
When comparing Visual Infograph AI Dash and Piktochart, you can also consider the following products