 Visual Infograph AI Dash
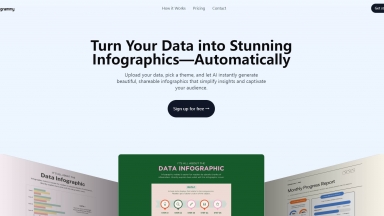
数分で魅力的なインフォグラフィックを作成しましょう!Visual Infograph AI Dashは、AIを活用してデータを変換します。レポート、プレゼンテーション、マーケティングに最適です。
 Text2Infographic
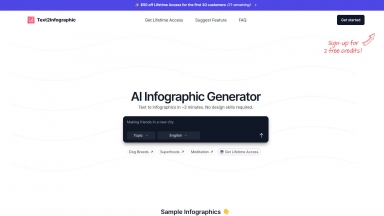
Text to Infographic は、あなたのブログ、ソーシャルメディアなどに、テキストを視覚化する AI インフォグラフィックジェネレーターです。
Visual Infograph AI Dash
| Launched | 2025-04 |
| Pricing Model | Paid |
| Starting Price | $15/month |
| Tech used | Microsoft Clarity,Cloudflare CDN,Google Fonts,Gzip,OpenGraph |
| Tag | Visual Design |
Text2Infographic
| Launched | 2024-05 |
| Pricing Model | Free Trial |
| Starting Price | |
| Tech used | Plausible Analytics,Next.js,Vercel,Gzip,OpenGraph,Webpack,HSTS |
| Tag | Text To Infographic,Data Visualization,Content Creation |
Visual Infograph AI Dash Rank/Visit
| Global Rank | |
| Country | |
| Month Visit |
Top 5 Countries
Traffic Sources
Text2Infographic Rank/Visit
| Global Rank | 600093 |
| Country | India |
| Month Visit | 56247 |
Top 5 Countries
11.04%
8.45%
7.81%
6.62%
5.24%
India
United States
Nigeria
Australia
Mexico
Traffic Sources
4.61%
0.9%
0.18%
13.68%
44.22%
36.33%
social
paidReferrals
mail
referrals
search
direct
Estimated traffic data from Similarweb
What are some alternatives?
When comparing Visual Infograph AI Dash and Text2Infographic, you can also consider the following products
GraphicInfo - AI搭載ツールで、記事から魅力的なインフォグラフィックを作成しましょう。
Piktochart - Piktochart AIを使えば、あなたのアイデアが、目を引くブランドイメージに沿ったインフォグラフィック、レポート、プレゼンテーションへとわずか数秒で生まれ変わります。AIが、デザイン作業を驚くほど簡単にします。
Infographics AI - Transform your data into beautiful visual infographics in seconds with our AI-powered infographics generator. Perfect for digital marketing infographics, business presentations, and content creation.
Vdraw.ai - VDraw:テキスト、ファイル、またはビデオを、驚くほど美しいインフォグラフィックに変換するAI搭載ツールです。デザインスキルは一切不要です。フォント、色、アイコンをカスタマイズして、簡単に共有できます。