What is VibeChart?
VibeChart transforms the way you work with data. Instead of spending valuable time manually cleaning data and building charts in complex spreadsheet software, you can now generate stunning, accurate visuals simply by describing what you need. It's a powerful tool designed for business and research teams who need to move from raw data to clear insights, fast.
Key Features
VibeChart streamlines your entire data visualization workflow with a suite of intelligent features.
🤖 AI-Powered Text-to-Chart Generation Use plain English to command your data. Simply type requests like "Show monthly revenue vs. expenses as a bar chart" or "Create a pie chart of users by age group," and VibeChart instantly builds the visual. With support for over 40 chart types, you can create and customize visuals without touching a single complex menu.
🧹 Built-in Data Engineer Stop wrestling with messy data. VibeChart’s AI can clean, transform, and extract insights from imperfect datasets. It intelligently handles common data issues, saving you the tedious pre-processing work typically required before visualization. You can instruct it to fix inconsistencies or extract specific information, turning raw inputs into presentation-ready material.
🔌 Flexible Data Import & Seamless Sharing Work with your data, wherever it lives. VibeChart accepts a wide range of inputs, including Excel files, CSVs, PDFs, pasted data, and even images of data tables. Once your chart is ready, share it effortlessly as an image, a direct link, or an embeddable element in tools like PowerPoint, Notion, Slack, and Google Slides.
⚡ High-Speed API Access Automate your charting workflows with a robust and reliable API. Built for speed and precision, it delivers chart generation with a sub-2-second response time and 99.9% uptime, making it a dependable solution for integrating automated visualizations into your own applications and reports.
How VibeChart Solves Your Problems
For Consultants & Analysts: A client sends you a data-heavy PDF report hours before a deadline. Instead of manually re-typing the numbers, you upload the PDF to VibeChart and instantly generate the key charts needed for your presentation, turning a potential crisis into a moment of efficiency.
For Product Managers: After a user survey, you have a spreadsheet filled with raw feedback and demographic data. With VibeChart, you can simply paste the data and ask questions like, "Show a heatmap of feature satisfaction by user age group," gaining immediate insights to inform your product roadmap.
For Business Owners: You need a quick snapshot of your monthly performance. You can paste data directly from your accounting software and ask VibeChart to "Create a line chart showing monthly revenue, expenses, and profit." The result is a clear, shareable visual ready for your team meeting in seconds.
Unique Advantages
VibeChart isn't just another charting tool; it fundamentally changes the process of data visualization.
While traditional tools require manual data selection and configuration, VibeChart uses a natural language interface. You simply tell it what you want to see, eliminating the clicks, menus, and formula-building of spreadsheet software.
Unlike most platforms that assume your data is perfectly clean, VibeChart includes a "built-in data engineer." This unique capability addresses the most time-consuming part of data analysis—data preparation—directly within the tool.
Beyond standard file uploads, VibeChart can generate structured charts from unstructured sources like PDFs and images. This allows you to extract and visualize data that would otherwise require tedious manual transcription.
Conclusion
VibeChart empowers you to focus on insights, not on the mechanics of creating charts. By handling everything from data cleanup to visualization with simple text commands, it dramatically accelerates your workflow and uncovers the stories hidden in your data. It's the smarter, faster way to turn numbers into compelling visual narratives.

More information on VibeChart
Launched
2025-05
Pricing Model
Freemium
Starting Price
$ 20 / month
Global Rank
5151299
Follow
Month Visit
<5k
Tech used
Top 5 Countries
100%
India
Traffic Sources
1.17%
69.16%
29.67%
paidReferrals
search
direct
Source: Similarweb (Sep 25, 2025)
VibeChart was manually vetted by our editorial team and was first featured on 2025-08-08.
Related Searches
VibeChart Alternatives
Load more Alternatives-

-
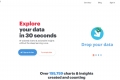
Turn your data into stunning, professional charts in seconds. Just upload your data, describe what you need, and watch the magic happen.
-
ChartPixel: Turn messy data into secure AI insights & interactive charts. Chat with your data, get clear explanations. No coding or data science needed.
-

-