
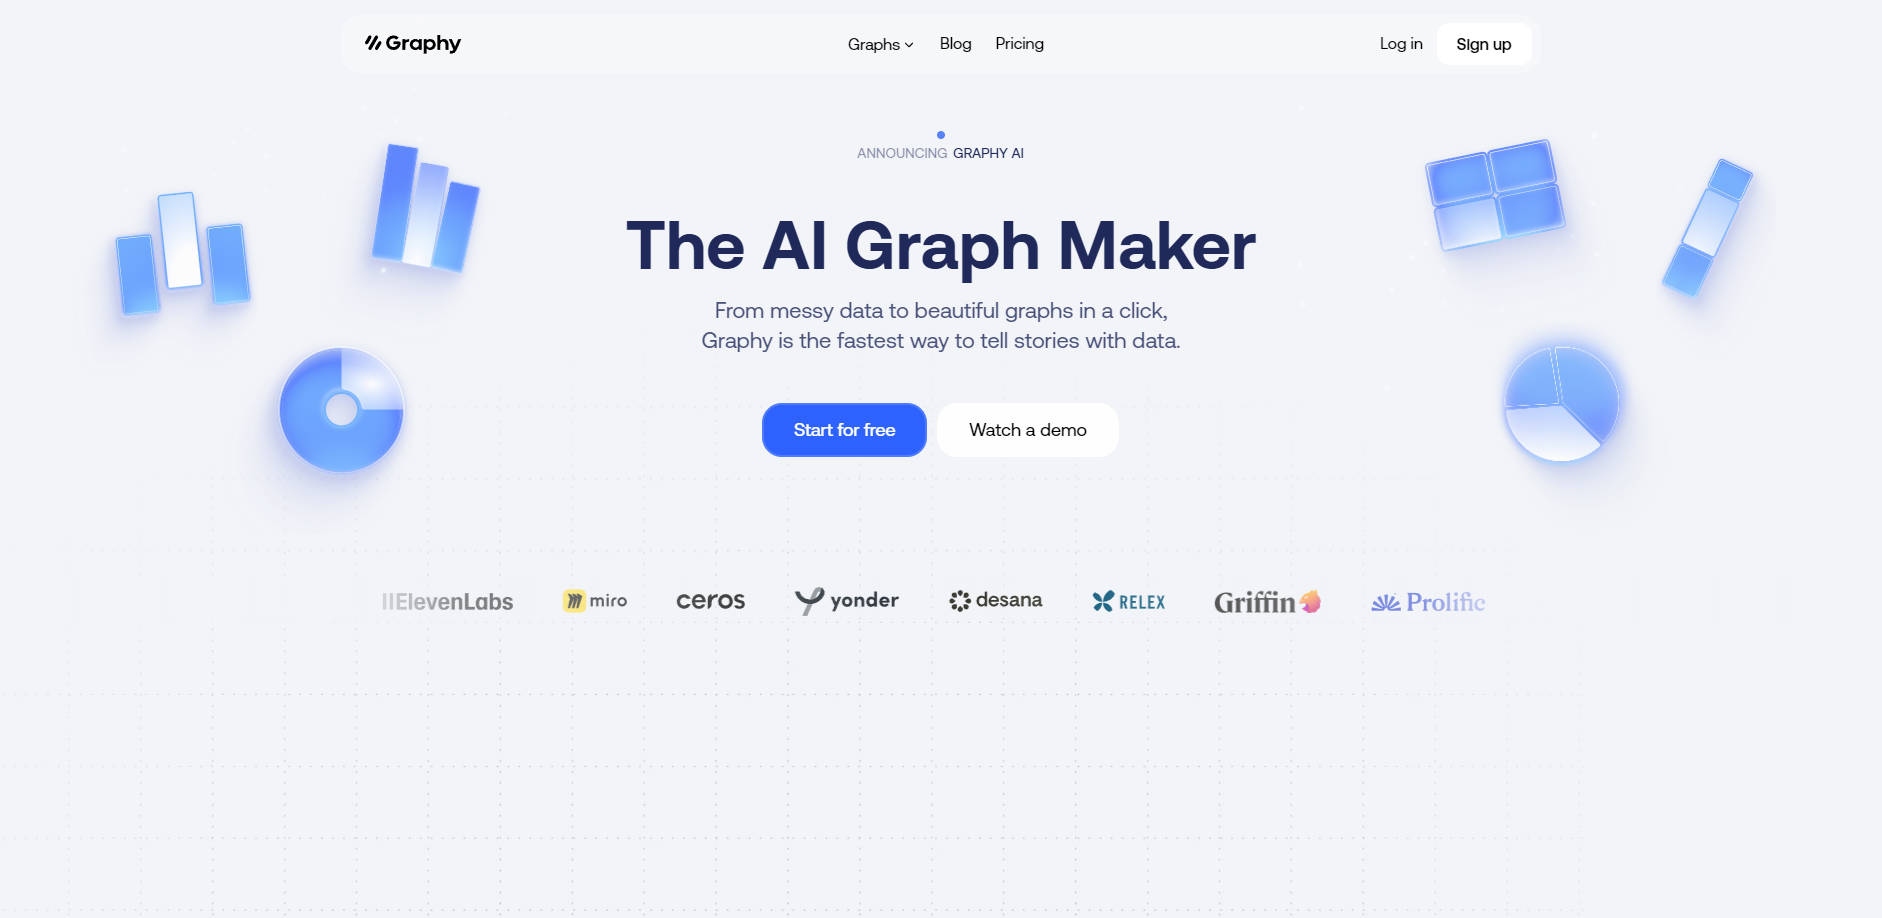
What is Graphy?
Tired of spending hours wrestling with spreadsheets to create mediocre charts? Graphy is an AI-powered platform designed to transform your raw, messy data into beautiful, insightful visualizations in seconds. It’s built for professionals who need to communicate data clearly, enabling faster decisions and stronger team alignment without the traditional complexity.
Key Features
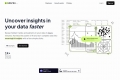
📊 AI-Powered Insight Engine Go from messy data to a clear story in a single click. Graphy's AI doesn't just plot your numbers; it analyzes your dataset to automatically identify and highlight the most significant insights. You can even "chat with your data" in plain English to get the exact chart or answer you need, instantly.
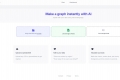
🔗 Flexible & Forgiving Data Integration Connect your data effortlessly, however you have it. Link a live Google Sheet for auto-updating dashboards, upload CSV or Excel files, paste values directly, or even ask the AI to find public data for you. Graphy is built to ingest it all without requiring you to pre-format or clean your tables.
🎨 Advanced Customization & Annotation Move beyond generic spreadsheet charts and create visualizations that are both professional and on-brand. Instantly apply your company’s colors and fonts, and then use powerful annotations, headline numbers, and trend lines to call out key wins and guide your audience’s attention to what truly matters.
🚀 Seamless Sharing & Embedding Put your data story right where your team works. Embed live, interactive graphs directly into tools like Notion, Canva, and your internal docs, or export high-quality static images for slide decks and social posts. A dedicated presenter mode ensures your data looks sharp in any meeting.
Use Cases
For Marketers: Streamline Your Reporting Instead of spending days compiling weekly performance reports, connect your data sources to Graphy. A Global Head of Marketing reported reducing a five-day reporting process to just four hours. Use the AI to instantly visualize campaign ROI, channel performance, and user engagement, then embed the live charts into your team's workspace for real-time updates.
For Founders: Craft Compelling Investor Updates Clearly communicate your company's growth and traction. Paste your key metrics into Graphy to generate clean, professional line graphs and bar charts for your investor memos and board decks. As the CEO of Yonder notes, it’s "super easy to make graphs in seconds" for internal reporting and board communications, eliminating the hassle of formatting in Excel.
For Analysts & Finance Teams: Deliver Actionable Insights Transform complex financial tables into clear, comparative charts that everyone can understand. Visualize budget vs. actuals, compare performance against targets, or track key metrics over time. By providing context and commentary directly on the chart, you ensure stakeholders can interpret the numbers correctly, leading to stronger alignment and faster decisions.
Why Choose Graphy?
Many tools can create charts, but Graphy is designed to create understanding. Here’s how it differs from traditional methods:
From Raw Data to Insight, Instantly: Standard spreadsheet tools require you to manually find the story within your data. Graphy’s AI does the heavy lifting, proactively suggesting insights and turning complex datasets into clear narratives. It moves you from data processor to data storyteller.
Professional Design Without the Effort: Say goodbye to the default, often clunky, designs of tools like Google Sheets. Graphy is built with aesthetics in mind, allowing you to create stunning, on-brand visualizations that look like they were made by a professional designer, in a fraction of the time.
Built for Communication, Not Just Calculation: Most data tools are passive, leaving interpretation up to the viewer. Graphy is an active communication tool. Features like annotations and context-setting commentary are built-in, helping you create charts that don't just present numbers—they make a clear and persuasive point.
"Thanks to Graphy 5 days of reporting were done in 4 hours. My team were in love!" — Cindy Ibanez, Global Head of Marketing at Wynwood House
FAQ
1. What kind of data sources can I use with Graphy? You can use a wide variety of sources. Graphy supports direct connections to Google Sheets, file uploads (CSV, Excel), pasting data directly from your clipboard, and using its API for programmatic chart creation. The platform is designed to handle unformatted data, simplifying the import process.
2. How exactly does the AI help create better graphs? Graphy's AI works in several ways. First, it analyzes your raw data to identify key trends, outliers, and relationships, suggesting the most important stories to visualize. Second, you can use a chat-like interface to ask questions (e.g., "Compare sales by region for Q2"), and the AI will generate the appropriate chart, saving you from manual setup.
3. Can I customize charts to match my company's branding? Absolutely. Graphy offers robust customization options. You can easily apply custom color palettes, use specific fonts, add your logo, and adjust nearly every visual element to ensure your graphs align perfectly with your company's brand identity.
More information on Graphy
Launched
2021-07
Pricing Model
Freemium
Starting Price
$20 per user/month
Global Rank
192097
Follow
Month Visit
176.8K
Tech used
Next.js,Vercel,Webpack,HSTS
Top 5 Countries
15.81%
10.69%
5.44%
3%
2.9%
United States
India
Korea, Republic of
Taiwan
Australia
Traffic Sources
2.77%
0.83%
0.11%
12.08%
43.11%
41.02%
social
paidReferrals
mail
referrals
search
direct
Source: Similarweb (Sep 24, 2025)
Graphy was manually vetted by our editorial team and was first featured on 2023-06-03.
Related Searches
Graphy Alternatives
Load more Alternatives-

AI Graph Maker simplifies data viz. Create stunning graphs in clicks with AI. Responsive, customizable, multi-format export. Ideal for pros & beginners.
-
-

-
Turn your data into stunning, professional charts in seconds. Just upload your data, describe what you need, and watch the magic happen.
-
Create a professional chart for free with the first AI-powered graph maker. Make custom bar charts, scatter plots, pie charts, histograms, and line charts in seconds.