 Gleek
Gleek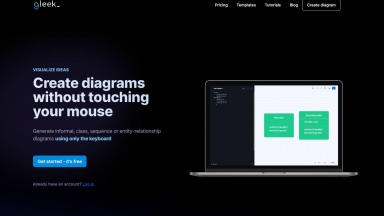
 Code to Flowchart
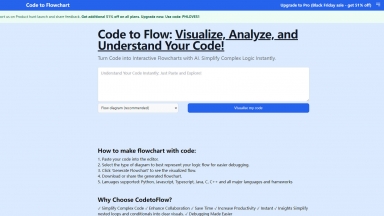
使用 Code to Flowchart 从代码中生成可视化流程图。了解复杂的结构、分析代码并有效地优化。立即尝试!
Gleek
| Launched | 2019-1 |
| Pricing Model | Free Trial |
| Starting Price | 6.95/ month |
| Tech used | Next.js,Gzip,Webpack |
| Tag | Text To Flow Chart,Data Visualization |
Code to Flowchart
| Launched | 2023-8 |
| Pricing Model | Free Trial |
| Starting Price | |
| Tech used | Google Ads,Google Analytics,Google Tag Manager,Microsoft Clarity,cdnjs,Gzip |
| Tag | Text To Flow Chart,Software Development,Code Review |
Gleek Rank/Visit
| Global Rank | 395382 |
| Country | India |
| Month Visit | 103853 |
Top 5 Countries
10.48%
8.08%
5.11%
4.36%
3.9%
India
United States
Malaysia
Australia
Indonesia
Traffic Sources
3.24%
0.82%
0.1%
9.4%
54.34%
32.06%
social
paidReferrals
mail
referrals
search
direct
Code to Flowchart Rank/Visit
| Global Rank | 1047884 |
| Country | India |
| Month Visit | 29215 |
Top 5 Countries
21.22%
17.33%
11.54%
9.02%
6.3%
India
United States
Philippines
Indonesia
Germany
Traffic Sources
4.34%
0.94%
0.11%
9.34%
48.08%
37.07%
social
paidReferrals
mail
referrals
search
direct
Estimated traffic data from Similarweb
What are some alternatives?
When comparing Gleek and Code to Flowchart, you can also consider the following products
DiagramGuru - 使用 DiagramGuru AI,通过自然语言即刻生成专业的流程图、数据图和组件图。无需复杂的软件!
DiagramGPT - 生成技术图表,采用代码或自然语言。 Eraser 提供技术支持。
RapidChart - RapidChart AI:将文本/代码快速转化为专业的UML、C4、ER等技术图表,是开发者、架构师、工程师的必备利器。
Diagram.chat - 使用 AI 生成、主题、字体、包括 GPT3.5 和 GPT4 在内的不同 AI 模型等功能创建 AI 驱动图表
Diagramly.ai - Diagramly 是一款由 AI 驱动的助手,可以根据您的文本或图像生成 PlantUML、Mermaid 和 ZenUML 格式的图表。