 BizGen
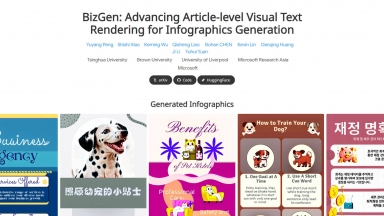
 Visual Infograph AI Dash
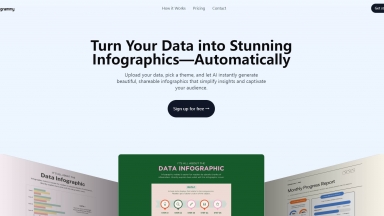
幾分鐘內就能製作出引人入勝的資訊圖表! Visual Infograph AI Dash 運用 AI 技術轉換您的數據資料,非常適合用於報告、簡報和行銷。
BizGen
| Launched | |
| Pricing Model | Free |
| Starting Price | |
| Tech used | Google Analytics,Google Tag Manager,Fastly,GitHub Pages |
| Tag | Text To Infographic,Academic Writing,Content Creation,Documentation Generation |
Visual Infograph AI Dash
| Launched | 2025-04 |
| Pricing Model | Paid |
| Starting Price | $15/month |
| Tech used | Microsoft Clarity,Cloudflare CDN |
| Tag | Visual Design |
BizGen Rank/Visit
| Global Rank | |
| Country | |
| Month Visit |
Top 5 Countries
Traffic Sources
Visual Infograph AI Dash Rank/Visit
| Global Rank | |
| Country | Algeria |
| Month Visit | 225 |
Top 5 Countries
100%
Algeria
Traffic Sources
0.36%
28.53%
46.98%
6.15%
15.34%
2.23%
mail
direct
search
social
referrals
paidReferrals
Estimated traffic data from Similarweb
What are some alternatives?
When comparing BizGen and Visual Infograph AI Dash, you can also consider the following products
Infographics AI - 運用我們的 AI 驅動資訊圖表生成器,幾秒內將您的資料轉化為精美的視覺化資訊圖表。無論是數位行銷資訊圖表、商業簡報,還是內容創作,皆能完美勝任。
GraphicInfo - 使用我們的人工智慧工具,從您的文章中製作引人入勝的資訊圖表。
Piktochart - Piktochart AI 能在短短數秒內,將您的想法轉化為精美且符合品牌調性的資訊圖表、報告與簡報。運用 AI 輕鬆設計。
EzyGraph - EzyGraph:免費 AI 資訊圖表製作工具。立即將文章與部落格轉換為引人入勝的視覺內容。簡單易用且高度客製化,有效提升互動率!