 EzyGraph
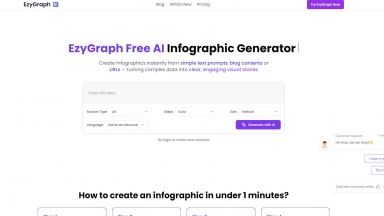
 Graphy
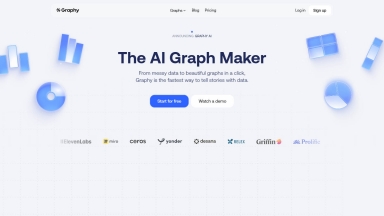
Graphy 的 AI 能在短短數秒內,將雜亂無章的資料轉化為專業且富有洞察力的圖表。製作清晰、簡報就緒的視覺圖表,助您做出更快速的決策,並實現更具影響力的溝通。
EzyGraph
| Launched | 2024-08 |
| Pricing Model | Freemium |
| Starting Price | $4.9/month |
| Tech used | Google Analytics,Cloudflare CDN,Next.js,Vercel,Gzip,HTTP/3,OpenGraph,Webpack,HSTS |
| Tag | Text To Infographic |
Graphy
| Launched | 2021-07 |
| Pricing Model | Freemium |
| Starting Price | $20 per user/month |
| Tech used | Next.js,Vercel,Webpack,HSTS |
| Tag | Data Integration,Data Visualization |
EzyGraph Rank/Visit
| Global Rank | 3854600 |
| Country | Vietnam |
| Month Visit | 4949 |
Top 5 Countries
39.71%
30.45%
22.49%
3.4%
2.62%
Vietnam
India
United States
France
Singapore
Traffic Sources
7.9%
1.31%
0.12%
9.85%
41.62%
38.71%
social
paidReferrals
mail
referrals
search
direct
Graphy Rank/Visit
| Global Rank | 192097 |
| Country | United States |
| Month Visit | 176834 |
Top 5 Countries
15.81%
10.69%
5.44%
3%
2.9%
United States
India
Korea, Republic of
Taiwan
Australia
Traffic Sources
2.77%
0.83%
0.11%
12.08%
43.11%
41.02%
social
paidReferrals
mail
referrals
search
direct
Estimated traffic data from Similarweb
What are some alternatives?
When comparing EzyGraph and Graphy, you can also consider the following products
Text2Infographic - Text to Infographic 是一款 AI 圖表生成器,可以將您的文字轉換成視覺化內容,適用於您的部落格、社群媒體等等。
GraphicInfo - 使用我們的人工智慧工具,從您的文章中製作引人入勝的資訊圖表。
Visual Infograph AI Dash - 幾分鐘內就能製作出引人入勝的資訊圖表! Visual Infograph AI Dash 運用 AI 技術轉換您的數據資料,非常適合用於報告、簡報和行銷。
Viz Graph Maker - AI Graph Maker 簡化數據視覺化。只需點擊幾下,即可透過 AI 創造令人驚豔的圖表。響應式、可自訂、支援多種格式匯出。專業人士和新手皆適用。