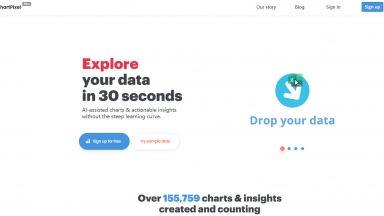
 ChartPixel
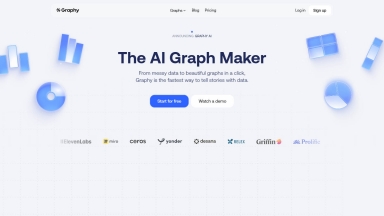
 Graphy
ChartPixel
| Launched | 2020-12 |
| Pricing Model | Freemium |
| Starting Price | |
| Tech used | cdnjs,Cloudflare CDN,JSDelivr,Google Fonts,Bootstrap,jQuery,Gzip,JSON Schema,OpenGraph,HSTS |
| Tag | Data Visualization,Data Analysis |
Graphy
| Launched | 2021-07 |
| Pricing Model | Freemium |
| Starting Price | $20 per user/month |
| Tech used | Next.js,Vercel,Webpack,HSTS |
| Tag | Data Integration,Data Visualization |
ChartPixel Rank/Visit
| Global Rank | 1574981 |
| Country | India |
| Month Visit | 16627 |
Top 5 Countries
Traffic Sources
Graphy Rank/Visit
| Global Rank | 192097 |
| Country | United States |
| Month Visit | 176834 |
Top 5 Countries
Traffic Sources
Estimated traffic data from Similarweb
What are some alternatives?
ChartFast - AI data analyst tool designed to streamline your data visualization and analysis tasks. It automates repetitive and time-consuming data work, allowing you to generate precise and sleek graphs in seconds.
ChartGen.ai - Turn your data into stunning, professional charts in seconds. Just upload your data, describe what you need, and watch the magic happen.
Piktochart - Piktochart AI transforms your ideas into stunning, on-brand infographics, reports & presentations in seconds. Design effortlessly with AI.
VibeChart - VibeChart: AI-powered data visualization. Simply describe your data, get instant charts & clean insights. Save time, make smart decisions.