 ChartPixel
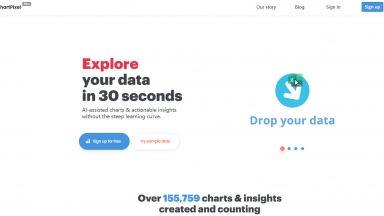
ChartPixel: 將凌亂資料轉化為安全可靠的 AI 洞見與互動式圖表。與您的資料輕鬆對談,獲取清晰易懂的說明。無需編程或資料科學知識。
 Graphy
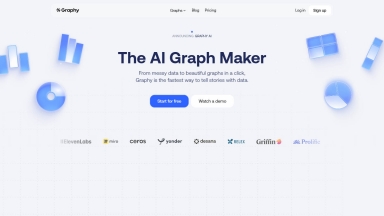
Graphy 的 AI 能在短短數秒內,將雜亂無章的資料轉化為專業且富有洞察力的圖表。製作清晰、簡報就緒的視覺圖表,助您做出更快速的決策,並實現更具影響力的溝通。
ChartPixel
| Launched | 2020-12 |
| Pricing Model | Freemium |
| Starting Price | |
| Tech used | cdnjs,Cloudflare CDN,JSDelivr,Google Fonts,Bootstrap,jQuery,Gzip,JSON Schema,OpenGraph,HSTS |
| Tag | Data Visualization,Data Analysis |
Graphy
| Launched | 2021-07 |
| Pricing Model | Freemium |
| Starting Price | $20 per user/month |
| Tech used | Next.js,Vercel,Webpack,HSTS |
| Tag | Data Integration,Data Visualization |
ChartPixel Rank/Visit
| Global Rank | 1574981 |
| Country | India |
| Month Visit | 16627 |
Top 5 Countries
23.45%
18.11%
15.21%
6.05%
5.77%
India
United States
Malaysia
Pakistan
Vietnam
Traffic Sources
5.31%
0.95%
0.16%
24.63%
37.91%
30.76%
social
paidReferrals
mail
referrals
search
direct
Graphy Rank/Visit
| Global Rank | 192097 |
| Country | United States |
| Month Visit | 176834 |
Top 5 Countries
15.81%
10.69%
5.44%
3%
2.9%
United States
India
Korea, Republic of
Taiwan
Australia
Traffic Sources
2.77%
0.83%
0.11%
12.08%
43.11%
41.02%
social
paidReferrals
mail
referrals
search
direct
Estimated traffic data from Similarweb
What are some alternatives?
When comparing ChartPixel and Graphy, you can also consider the following products
ChartFast - AI 資料分析工具,旨在簡化您的資料視覺化和分析工作。 它自動化重複且耗時的資料工作,讓您在幾秒鐘內就能生成精準且美觀的圖表。
ChartGen.ai - Turn your data into stunning, professional charts in seconds. Just upload your data, describe what you need, and watch the magic happen.
Piktochart - Piktochart AI 能在短短數秒內,將您的想法轉化為精美且符合品牌調性的資訊圖表、報告與簡報。運用 AI 輕鬆設計。
VibeChart - VibeChart:AI人工智慧驅動的資料視覺化。只需簡單描述您的資料,VibeChart 就能即時為您繪製圖表,提供清晰的洞察見解。節省寶貴時間,做出明智決策。