 contextualize.ai
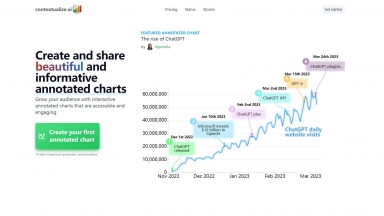
Create and share interactive annotated charts with contextualize.ai. Grow your audience with visually appealing charts and engaging annotations.
 Vizly
Vizly
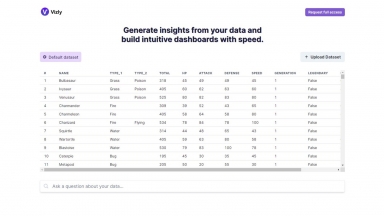
Supercharge your data analysis and visualization with Vizly, an AI tool that automates insights and builds intuitive dashboards. Try it now!
contextualize.ai
| Launched | 2019-08-25 |
| Pricing Model | Freemium |
| Starting Price | $9 per month |
| Tech used | Next.js,Vercel,Gravatar,Gzip,OpenGraph,Webpack,HSTS |
| Tag | Data visualization |
Vizly
| Launched | 2023-04-18 |
| Pricing Model | Freemium |
| Starting Price | $40/month |
| Tech used | Cloudflare CDN,Next.js,Emotion,Gzip,HTTP/3,OpenGraph,Webpack |
| Tag | Data visualization |
contextualize.ai Rank/Visit
| Global Rank | 14027453 |
| Country | |
| Month Visit | 2388 |
Top 5 Countries
26.14%
20.79%
16.52%
16.06%
12.03%
United States
Philippines
India
Malaysia
United Kingdom
Traffic Sources
100%
0%
Social
Search
Vizly Rank/Visit
| Global Rank | 1696155 |
| Country | United States |
| Month Visit | 22507 |
Top 5 Countries
72.72%
10.47%
6.4%
2.38%
1.85%
United States
Albania
Germany
Japan
United Kingdom
Traffic Sources
79.33%
14.54%
5.37%
0.76%
Direct
Search
Referrals
Social
What are some alternatives?
When comparing contextualize.ai and Vizly, you can also consider the following products
Context.ai - Context.ai enables builders of LLM applications to build better products, with pre-launch evaluations and post-launch user analytics
ChartPixel - Go beyond visualization and gain valuable insights with ChartPixel's AI-assisted data analysis — fast and no matter your skill level
Piktochart - Create stunning visuals effortlessly with Piktochart’s AI-powered infographic maker. Simplify complex data, streamline collaboration, and enhance communication.
Tableau AI - Tableau can help anyone see and understand their data. Connect to almost any database, drag and drop to create visualizations, and share with a click.