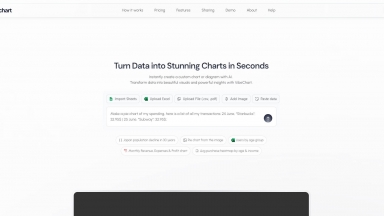
 VibeChart
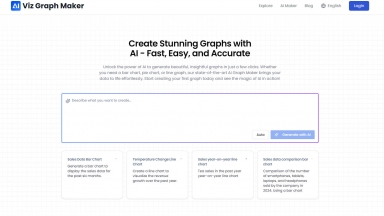
 Viz Graph Maker
VibeChart
| Launched | 2025-05 |
| Pricing Model | Freemium |
| Starting Price | $ 20 / month |
| Tech used | |
| Tag | Data Visualization,Data Analysis,Text To Image |
Viz Graph Maker
| Launched | 2024-11 |
| Pricing Model | Freemium |
| Starting Price | |
| Tech used | Cloudflare CDN,Google Fonts,Gzip,HTTP/3,OpenGraph,HSTS |
| Tag | Data Visualization,Invitation Maker,Certificate Maker |
VibeChart Rank/Visit
| Global Rank | 5151299 |
| Country | India |
| Month Visit | 2581 |
Top 5 Countries
Traffic Sources
Viz Graph Maker Rank/Visit
| Global Rank | 717337 |
| Country | United States |
| Month Visit | 46600 |
Top 5 Countries
Traffic Sources
Estimated traffic data from Similarweb
What are some alternatives?
ChartFast - AI data analyst tool designed to streamline your data visualization and analysis tasks. It automates repetitive and time-consuming data work, allowing you to generate precise and sleek graphs in seconds.
ChartGen.ai - Turn your data into stunning, professional charts in seconds. Just upload your data, describe what you need, and watch the magic happen.
ChartPixel - ChartPixel: Turn messy data into secure AI insights & interactive charts. Chat with your data, get clear explanations. No coding or data science needed.
Graphy - Graphy's AI transforms messy data into professional, insightful graphs in seconds. Create clear, presentation-ready visuals for faster decisions & powerful communication.
Vizzy - Presenting data in a meaningful and understandable way can be a challenge, especially for those unfamiliar with numbers and statistics – that's where Vizzy comes in, offering AI data interpretation.