 Piktochart
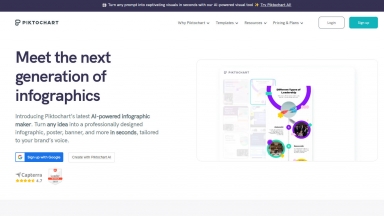
Piktochart AIを使えば、あなたのアイデアが、目を引くブランドイメージに沿ったインフォグラフィック、レポート、プレゼンテーションへとわずか数秒で生まれ変わります。AIが、デザイン作業を驚くほど簡単にします。
 PPT.AI
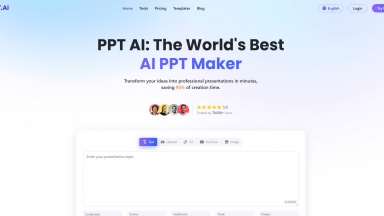
PPT.AI: AIプレゼンテーション作成ツール。
テキスト、ドキュメント、URL、動画といった情報源から、わずか数分でプロ品質のスライドを生成します。
これにより、魅力的なプレゼンテーション作成にかかる時間を大幅に短縮し、作業効率を飛躍的に向上させます。
Piktochart
| Launched | 2011-6 |
| Pricing Model | Freemium |
| Starting Price | |
| Tech used | Google Tag Manager,Sign in with Google,Cloudflare CDN,WordPress,OneTrust,Bootstrap,Amazon AWS S3 |
| Tag | Text To Infographic,Presentation Maker,Data Visualization |
PPT.AI
| Launched | 2017-12 |
| Pricing Model | Freemium |
| Starting Price | $ 19.9 /mo |
| Tech used | Cloudflare Analytics,Google Analytics,Google Tag Manager,Microsoft Clarity,Plausible Analytics,Cloudflare CDN,Bootstrap |
| Tag | Design Generators,Presentation Maker,Text To Image,Ppt Maker |
Piktochart Rank/Visit
| Global Rank | 32193 |
| Country | United States |
| Month Visit | 1460931 |
Top 5 Countries
15.76%
9.37%
7.11%
5.29%
3.78%
United States
India
Mexico
Colombia
Peru
Traffic Sources
1.06%
0.43%
0.07%
4.62%
64.36%
29.46%
social
paidReferrals
mail
referrals
search
direct
PPT.AI Rank/Visit
| Global Rank | 261552 |
| Country | India |
| Month Visit | 133041 |
Top 5 Countries
37.85%
23.72%
6.15%
5.07%
4.99%
India
Vietnam
China
Pakistan
United States
Traffic Sources
9.84%
1.05%
0.08%
16.91%
46.82%
25.29%
social
paidReferrals
mail
referrals
search
direct
Estimated traffic data from Similarweb
What are some alternatives?
When comparing Piktochart and PPT.AI, you can also consider the following products
Visual Infograph AI Dash - 数分で魅力的なインフォグラフィックを作成しましょう!Visual Infograph AI Dashは、AIを活用してデータを変換します。レポート、プレゼンテーション、マーケティングに最適です。
aiflowchart.io - AIフローチャートを使用すると、図の作成に毎週何時間も節約できます。
GraphicInfo - AI搭載ツールで、記事から魅力的なインフォグラフィックを作成しましょう。
Smallppt - Smallppt AIで、プロフェッショナルなプレゼンテーションをわずか数分で作成。アイデアや資料を瞬時に、洗練されたスライドへと生まれ変わらせます。時間の節約と、スムーズな共同作業を実現します。