 Piktochart
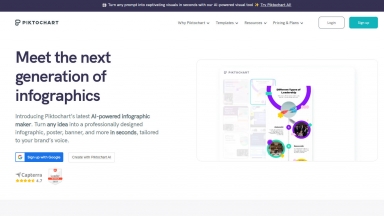
 PPT.AI
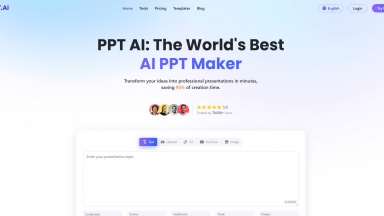
PPT.AI: AI幻灯片制作工具。
将文字、文档、网址及视频,在数分钟内转化为精美专业的幻灯片。助您大幅节省时间,快速制作出令人惊艳的演示文稿。
Piktochart
| Launched | 2011-6 |
| Pricing Model | Freemium |
| Starting Price | |
| Tech used | Google Tag Manager,Sign in with Google,Cloudflare CDN,WordPress,OneTrust,Bootstrap,Amazon AWS S3 |
| Tag | Text To Infographic,Presentation Maker,Data Visualization |
PPT.AI
| Launched | 2017-12 |
| Pricing Model | Freemium |
| Starting Price | $ 19.9 /mo |
| Tech used | Cloudflare Analytics,Google Analytics,Google Tag Manager,Microsoft Clarity,Plausible Analytics,Cloudflare CDN,Bootstrap |
| Tag | Design Generators,Presentation Maker,Text To Image,Ppt Maker |
Piktochart Rank/Visit
| Global Rank | 32193 |
| Country | United States |
| Month Visit | 1460931 |
Top 5 Countries
15.76%
9.37%
7.11%
5.29%
3.78%
United States
India
Mexico
Colombia
Peru
Traffic Sources
1.06%
0.43%
0.07%
4.62%
64.36%
29.46%
social
paidReferrals
mail
referrals
search
direct
PPT.AI Rank/Visit
| Global Rank | 261552 |
| Country | India |
| Month Visit | 133041 |
Top 5 Countries
37.85%
23.72%
6.15%
5.07%
4.99%
India
Vietnam
China
Pakistan
United States
Traffic Sources
9.84%
1.05%
0.08%
16.91%
46.82%
25.29%
social
paidReferrals
mail
referrals
search
direct
Estimated traffic data from Similarweb
What are some alternatives?
When comparing Piktochart and PPT.AI, you can also consider the following products
Visual Infograph AI Dash - 几分钟内创建引人注目的信息图!Visual Infograph AI Dash 利用人工智能技术转换您的数据,是报告、演示和营销的理想之选。
aiflowchart.io - 使用 AI 流程图,您可以每周节省数小时用于创建图表。
GraphicInfo - 使用我们的 AI 工具,从您的文章中创建引人入胜的信息图表。
Smallppt - 借助 Smallppt AI,几分钟内即可制作出专业级的演示文稿。将您的想法或文档瞬间转化为精美专业的幻灯片,助您节省宝贵时间,轻松实现高效协作。