 Piktochart
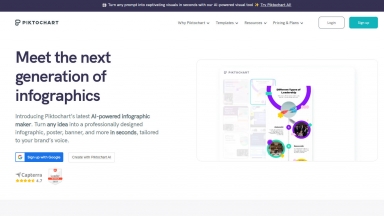
 PPT.AI
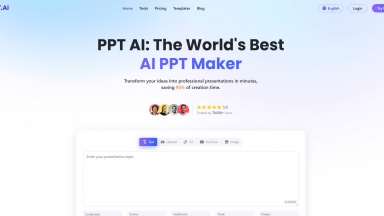
Piktochart
| Launched | 2011-6 |
| Pricing Model | Freemium |
| Starting Price | |
| Tech used | Google Tag Manager,Sign in with Google,Cloudflare CDN,WordPress,OneTrust,Bootstrap,jQuery,Gzip,JSON Schema,LiteSpeed Cache,OpenGraph,PHP,Amazon AWS S3 |
| Tag | Text To Infographic,Presentation Maker,Data Visualization |
PPT.AI
| Launched | 2017-12 |
| Pricing Model | Freemium |
| Starting Price | $ 19.9 /mo |
| Tech used | |
| Tag | Design Generators,Presentation Maker,Text To Image |
Piktochart Rank/Visit
| Global Rank | 32193 |
| Country | United States |
| Month Visit | 1460931 |
Top 5 Countries
15.76%
9.37%
7.11%
5.29%
3.78%
United States
India
Mexico
Colombia
Peru
Traffic Sources
1.06%
0.43%
0.07%
4.62%
64.36%
29.46%
social
paidReferrals
mail
referrals
search
direct
PPT.AI Rank/Visit
| Global Rank | 261552 |
| Country | India |
| Month Visit | 133041 |
Top 5 Countries
37.85%
23.72%
6.15%
5.07%
4.99%
India
Vietnam
China
Pakistan
United States
Traffic Sources
9.84%
1.05%
0.08%
16.91%
46.82%
25.29%
social
paidReferrals
mail
referrals
search
direct
Estimated traffic data from Similarweb
What are some alternatives?
When comparing Piktochart and PPT.AI, you can also consider the following products
Visual Infograph AI Dash - 幾分鐘內就能製作出引人入勝的資訊圖表! Visual Infograph AI Dash 運用 AI 技術轉換您的數據資料,非常適合用於報告、簡報和行銷。
aiflowchart.io - 使用 AI 流程圖,您可以每周節省數小時的圖表製作時間。
GraphicInfo - 使用我們的人工智慧工具,從您的文章中製作引人入勝的資訊圖表。
Smallppt - Smallppt AI 讓您數分鐘內即可製作出專業簡報。輕鬆將您的想法或文件,即刻轉化為精美吸睛的投影片。大幅節省您的時間,並讓團隊協作更加順暢。