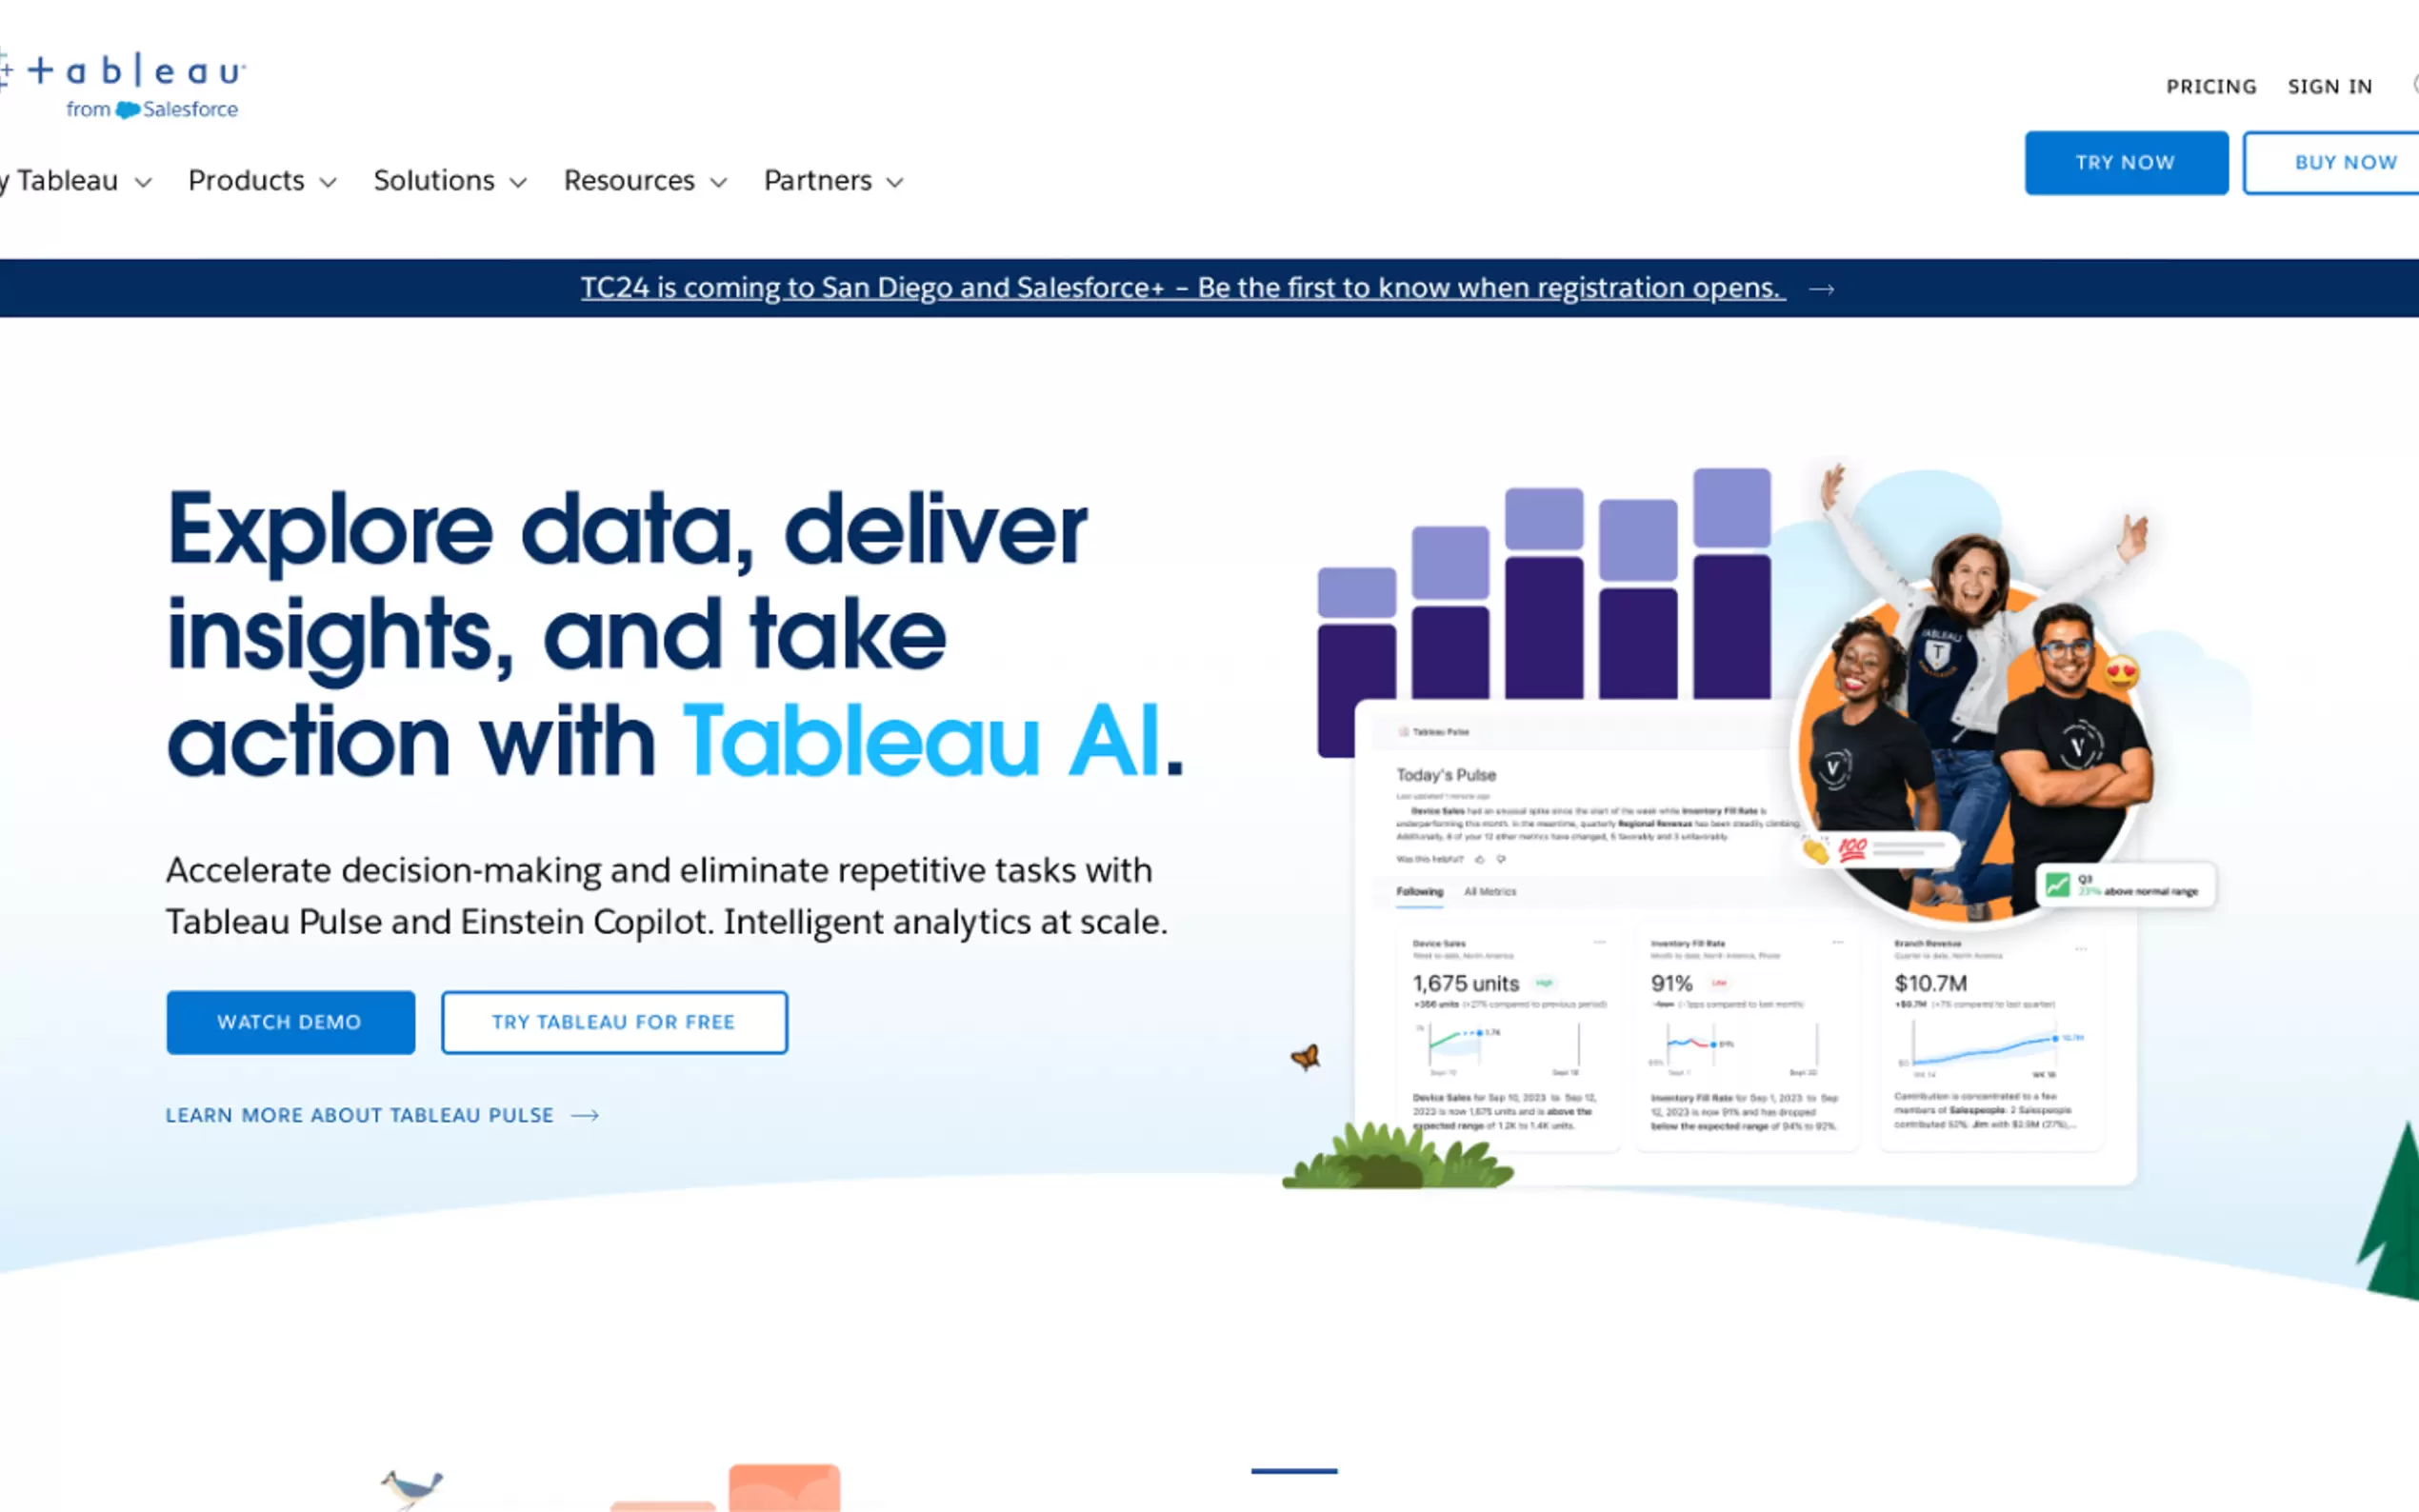
What is Tableau AI?
Tableau is a leading visual analytics platform designed to help anyone see and understand their data. It transforms the way people use data to solve problems, empowering individuals and organizations to make faster, more confident decisions based on trusted insights.
Key Features:
📊 Intuitive Visual Analysis: Explore your data and ask questions naturally using Tableau's patented VizQL technology. Simply drag and drop data fields to instantly create powerful visualizations, making complex analysis accessible without needing deep technical skills.
🧠 Integrated AI and Machine Learning: Leverage built-in AI capabilities, including Salesforce Einstein, agentic analytics (Tableau Next), and the Tableau Agent assistant, to uncover deeper insights, automate analysis, and get AI-powered recommendations directly within your workflow.
🔌 Broad Data Connectivity: Connect to virtually any data source, whether it's a spreadsheet, database, data warehouse, or cloud application. Tableau provides a unified view of your data, allowing you to bring together disparate sources for comprehensive analysis.
🤝 Seamless Collaboration & Sharing: Share your findings easily with colleagues via interactive dashboards and reports. Access insights from anywhere on any device, fostering teamwork and ensuring everyone in your organization has access to the data they need.
🔒 Robust Governance and Security: Deploy Tableau with confidence, on-premises or in the cloud, with built-in governance, security certifications (like SOCII, ISO), and data management capabilities. Ensure data trust and compliance while scaling analytics across your organization.
How Tableau Solves Your Problems:
Tableau is built to address the challenges of making data accessible, understandable, and actionable for everyone, regardless of their technical background.
For Business Leaders: Quickly gain a clear view of performance metrics, identify trends, and make strategic decisions with AI-powered dashboards and reports, boosting efficiency and driving better outcomes.
For Analysts: Accelerate your data exploration and discovery process. Use intuitive visual tools and AI assistance to uncover hidden patterns and build compelling data stories faster than ever before.
For Data & IT Leaders: Provide a trusted, governed analytics platform that scales with your organization. Manage data access, ensure data quality, and deploy flexibly while maintaining security and compliance.
For Developers: Embed analytics into your applications and build custom data solutions for your teams or clients, leveraging Tableau's open and flexible platform.
Why Choose Tableau?
Tableau stands out as a market leader because of its unwavering mission to help people see and understand data, backed by unique strengths:
Intuitive Design: Founded on the principle that analysis should be about asking questions, not learning software, Tableau's visual approach (VizQL) makes data exploration genuinely intuitive and fast.
Comprehensive Platform: Tableau offers a complete, end-to-end platform covering data preparation (Tableau Prep), analysis (Tableau Desktop, Cloud, Server), governance, and collaboration, integrated with modern AI capabilities.
Powerful Community & Data Culture Partner: With over a million active members, the vibrant Tableau Community provides unparalleled support, learning, and inspiration. Tableau also partners with organizations to help them build a strong data culture, ensuring successful, widespread adoption and value realization.
Conclusion:
Tableau empowers individuals and organizations to unlock the full potential of their data. By transforming complex data into clear, interactive visuals and leveraging integrated AI, Tableau helps you move from insights to action quickly and confidently.
More information on Tableau AI
Launched
1996-06
Pricing Model
Paid
Starting Price
Global Rank
5362
Follow
Month Visit
7.6M
Tech used
Google Tag Manager,OneTrust,Gzip,OpenGraph,HSTS,Nginx
Top 5 Countries
37.01%
13.06%
6.43%
5.03%
3.78%
United States
Japan
India
United Kingdom
Australia
Traffic Sources
0.7%
0.72%
0.11%
6.89%
34.81%
56.77%
social
paidReferrals
mail
referrals
search
direct
Source: Similarweb (Sep 24, 2025)
Tableau AI was manually vetted by our editorial team and was first featured on 2024-01-27.
Related Searches