 VibeChart
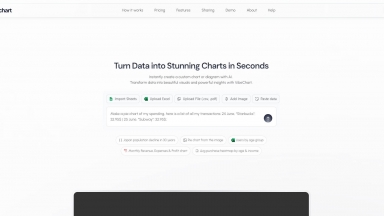
 ChartFast
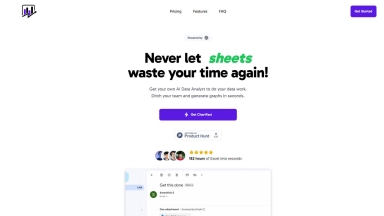
VibeChart
| Launched | 2025-05 |
| Pricing Model | Freemium |
| Starting Price | $ 20 / month |
| Tech used | |
| Tag | Data Visualization,Data Analysis,Text To Image |
ChartFast
| Launched | 2024-07 |
| Pricing Model | Paid |
| Starting Price | $9 USD /MONTH |
| Tech used | Plausible Analytics,Imgix,Next.js,Vercel,Gzip,JSON Schema,OpenGraph,Webpack,HSTS |
| Tag | Data Visualization,Data Analysis |
VibeChart Rank/Visit
| Global Rank | 5151299 |
| Country | India |
| Month Visit | 2581 |
Top 5 Countries
100%
India
Traffic Sources
1.17%
69.16%
29.67%
paidReferrals
search
direct
ChartFast Rank/Visit
| Global Rank | 6282813 |
| Country | India |
| Month Visit | 2309 |
Top 5 Countries
100%
India
Traffic Sources
89.1%
9.16%
1.73%
0%
Direct
Referrals
Social
Search
Estimated traffic data from Similarweb
What are some alternatives?
When comparing VibeChart and ChartFast, you can also consider the following products
ChartGen.ai - Turn your data into stunning, professional charts in seconds. Just upload your data, describe what you need, and watch the magic happen.
ChartPixel - ChartPixel: 将杂乱无章的数据转化为安全的AI洞察与交互式图表。与数据对话,获取清晰解读。无需编程或数据科学专业知识。
Graphy - Graphy 的 AI 能将凌乱的数据瞬间转化为专业而富有洞察力的图表。助您轻松创建清晰明了、演示级的视觉内容,从而加速决策,并实现高效有力的沟通。
Vizzy - 以富有含义且易于被大家所 understanding 的 manner 展示数据可能对不熟悉 numbers 且 statistics 的人來說难上加难 - 这也是我们推出可提供AI data interpret 的Vizy的原因。