 VibeChart
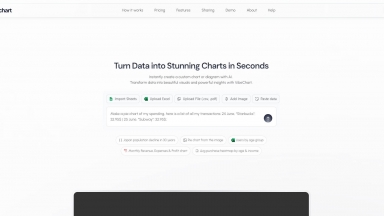
VibeChart:AI人工智慧驅動的資料視覺化。只需簡單描述您的資料,VibeChart 就能即時為您繪製圖表,提供清晰的洞察見解。節省寶貴時間,做出明智決策。
 ChartFast
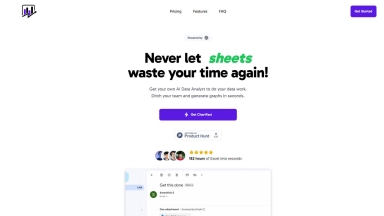
VibeChart
| Launched | 2025-05 |
| Pricing Model | Freemium |
| Starting Price | $ 20 / month |
| Tech used | |
| Tag | Data Visualization,Data Analysis,Text To Image |
ChartFast
| Launched | 2024-07 |
| Pricing Model | Paid |
| Starting Price | $9 USD /MONTH |
| Tech used | Plausible Analytics,Imgix,Next.js,Vercel,Gzip,JSON Schema,OpenGraph,Webpack,HSTS |
| Tag | Data Visualization,Data Analysis |
VibeChart Rank/Visit
| Global Rank | 5151299 |
| Country | India |
| Month Visit | 2581 |
Top 5 Countries
100%
India
Traffic Sources
1.17%
69.16%
29.67%
paidReferrals
search
direct
ChartFast Rank/Visit
| Global Rank | 6282813 |
| Country | India |
| Month Visit | 2309 |
Top 5 Countries
100%
India
Traffic Sources
89.1%
9.16%
1.73%
0%
Direct
Referrals
Social
Search
Estimated traffic data from Similarweb
What are some alternatives?
When comparing VibeChart and ChartFast, you can also consider the following products
ChartGen.ai - Turn your data into stunning, professional charts in seconds. Just upload your data, describe what you need, and watch the magic happen.
ChartPixel - ChartPixel: 將凌亂資料轉化為安全可靠的 AI 洞見與互動式圖表。與您的資料輕鬆對談,獲取清晰易懂的說明。無需編程或資料科學知識。
Graphy - Graphy 的 AI 能在短短數秒內,將雜亂無章的資料轉化為專業且富有洞察力的圖表。製作清晰、簡報就緒的視覺圖表,助您做出更快速的決策,並實現更具影響力的溝通。
Vizzy - 以有意義且易於理解的方式呈現數據是一項挑戰,特別是對於不熟悉數字和統計數據的人來說,這就是 Vizzy 派上用場的地方,提供 AI 數據解讀。