
Best Graphy Alternatives in 2025
-

AI Graph Maker simplifies data viz. Create stunning graphs in clicks with AI. Responsive, customizable, multi-format export. Ideal for pros & beginners.
-
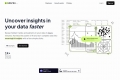
Uncover hidden trends and patterns in your data effortlessly. Harness the power of AI with your data science copilot, turning complex data into clear insights.
-

EzyGraph: Free AI infographic maker. Transform articles & blogs into engaging visuals instantly. Easy to use & customize. Boost engagement!
-
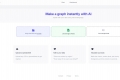
Turn your data into stunning, professional charts in seconds. Just upload your data, describe what you need, and watch the magic happen.
-
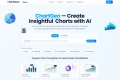
Create a professional chart for free with the first AI-powered graph maker. Make custom bar charts, scatter plots, pie charts, histograms, and line charts in seconds.
-
Piktochart AI transforms your ideas into stunning, on-brand infographics, reports & presentations in seconds. Design effortlessly with AI.
-
ChartPixel: Turn messy data into secure AI insights & interactive charts. Chat with your data, get clear explanations. No coding or data science needed.
-

VibeChart: AI-powered data visualization. Simply describe your data, get instant charts & clean insights. Save time, make smart decisions.
-
Graphis: Unified AI canvas for image, video & text generation, editing & automation. Ditch fragmented tools, boost your creative workflow.
-

DataGIF is an AI-powered tool that turns your data into captivating GIFs. Easily import from CSV/Excel, customize richly, and share freely. Ideal for social media, websites, and presentations.
-

Create compelling infographics in minutes! Visual Infograph AI Dash uses AI to transform your data. Perfect for reports, presentations & marketing.
-

AI data analyst tool designed to streamline your data visualization and analysis tasks. It automates repetitive and time-consuming data work, allowing you to generate precise and sleek graphs in seconds.
-

Presenton.ai is an AI - powered tool that swiftly turns data, reports into stunning, interactive presentations. With features like upload & transform, customizable slides, it suits everyone. Save time, get pro results.
-

Graphlit is an API-first platform for developers building AI-powered applications with unstructured data, which leverage domain knowledge in any vertical market such as legal, sales, entertainment, healthcare or engineering.
-

Graph.plus: Build apps & games faster with AI. Explore ideas in parallel, iterate at lightning speed, and collaborate seamlessly on a visual canvas.
-

Columns allows you to connect your live data sources, analyze it easily with AI's help, and craft beautiful and insightful data stories to share with people
-
Transform your data into beautiful visual infographics in seconds with our AI-powered infographics generator. Perfect for digital marketing infographics, business presentations, and content creation.
-

Create machine learning models with our no-code AI tool in minutes. Automatically transform data into key drivers, actionable insights, and strategic responses.
-

Infogram, an AI-driven tool with customizable templates, interactive content & advanced analytics. Empowers users to create stunning infographics for marketing, education & nonprofits. Seamless on all devices.
-

PageOn.AI is an AI-powered visual communication platform that helps you create stunning presentations, infographics, and interactive content with the help of AI agents.
-
The Ultimate Frontend UI for ChatGPT and other conversational AI • Expand ideas on canvas • Leverage every AI feature • Maximize control • Keep your data private Bring your API keys and start chatting!
-

Using AI Flowchart you can save hours each week creating diagrams.
-
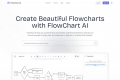
FlowChart AI: The AI-powered generator that turns your text into clear, professional flowcharts. Visualize complex processes & workflows effortlessly.
-

GraphDev is a purpose built toolkit to debug, test and collaborate with GraphQL. Unlock the power of schema-aware AI to generate queries/mutations, or just help you understand your graph better.
-

Grafvo is a user-friendly design platform with intuitive tools, customizable templates, AI assistance, and cross-device access. Ideal for all, it simplifies design for unique visuals.
-

Create engaging Infographic from your articles with our AI-powered tool.
-
Creately: The AI visual platform connecting diagrams, data & workflows. Go from idea to execution with seamless team planning & collaboration.
-
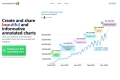
Create and share interactive annotated charts with contextualize.ai. Grow your audience with visually appealing charts and engaging annotations.
-
Line Graph Maker - Easily create custom line charts. Adjust axes, colors, tension. Download in JPG, PNG, SVG. Ideal for students, business, research. User-friendly!
-

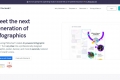
Text to Infographic is an AI Infographic Generator that turns your text into visuals for your blog, social media, and more.