
What is snowBrain?
snowBrain allows you to visualize the total revenue for each product category using a bar plot. It provides a Python script that utilizes the pandas and seaborn libraries to generate the plot.
Key Features:
Bar plot visualization of total revenue for each product category
Utilizes pandas and seaborn libraries for data manipulation and plotting
snowBrain enables users to visualize the total revenue for each product category through a bar plot. By executing a provided Python script, which utilizes the pandas and seaborn libraries, users can generate the plot with the product categories on the x-axis and the total revenue on the y-axis. The plot can be customized with labels and titles, and it requires the installation of the seaborn and pandas libraries.


More information on snowBrain
Launched
2023-07-08
Pricing Model
Free
Starting Price
Global Rank
20616630
Country
Month Visit
<5k
Tech used
Cloudinary,Next.js,Vercel,Gzip,OpenGraph,Webpack,HSTS
Top 5 Countries
73.9%
26.1%
Azerbaijan
United Kingdom
Traffic Sources
100%
0%
Direct
Search
Updated Date: 2024-03-06
snowBrain was manually vetted by our editorial team and was first featured on September 4th 2024.
snowBrain Alternatives
Load more Alternatives-
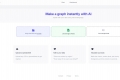
Create a professional chart for free with the first AI-powered graph maker. Make custom bar charts, scatter plots, pie charts, histograms, and line charts in seconds.
-
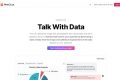
Talk With Data's PlotChat: Upload plot images, generate data tables, and get question-based explanations. Simplify data interpretation and gain insights with this powerful AI tool.
-
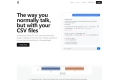
ChatCSV allows you to ask your CSV document anything. It's an Ask Me Anything for your spreadsheets.
-
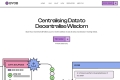
Build Your Own Brain (BYOB) is your AI-driven sidekick to aid all data and decision-making needs.
-

NeoAnalyst: Run powerful analysis and gain valuable insights effortlessly. No coding required. Pre-built models and predictive analytics. Explore now!