
What is Line graph maker?
The Line Graph Maker allows users to easily design and personalize line charts with a variety of customizable options. Whether for academic projects, business reports, or personal use, this tool enables the creation of professional-looking line graphs that can be downloaded in multiple formats such as JPG, PNG, or SVG. With intuitive controls for adjusting axes, grid lines, line tension, and colors, users can tailor their graphs to fit specific needs without any technical expertise.
Key Features:
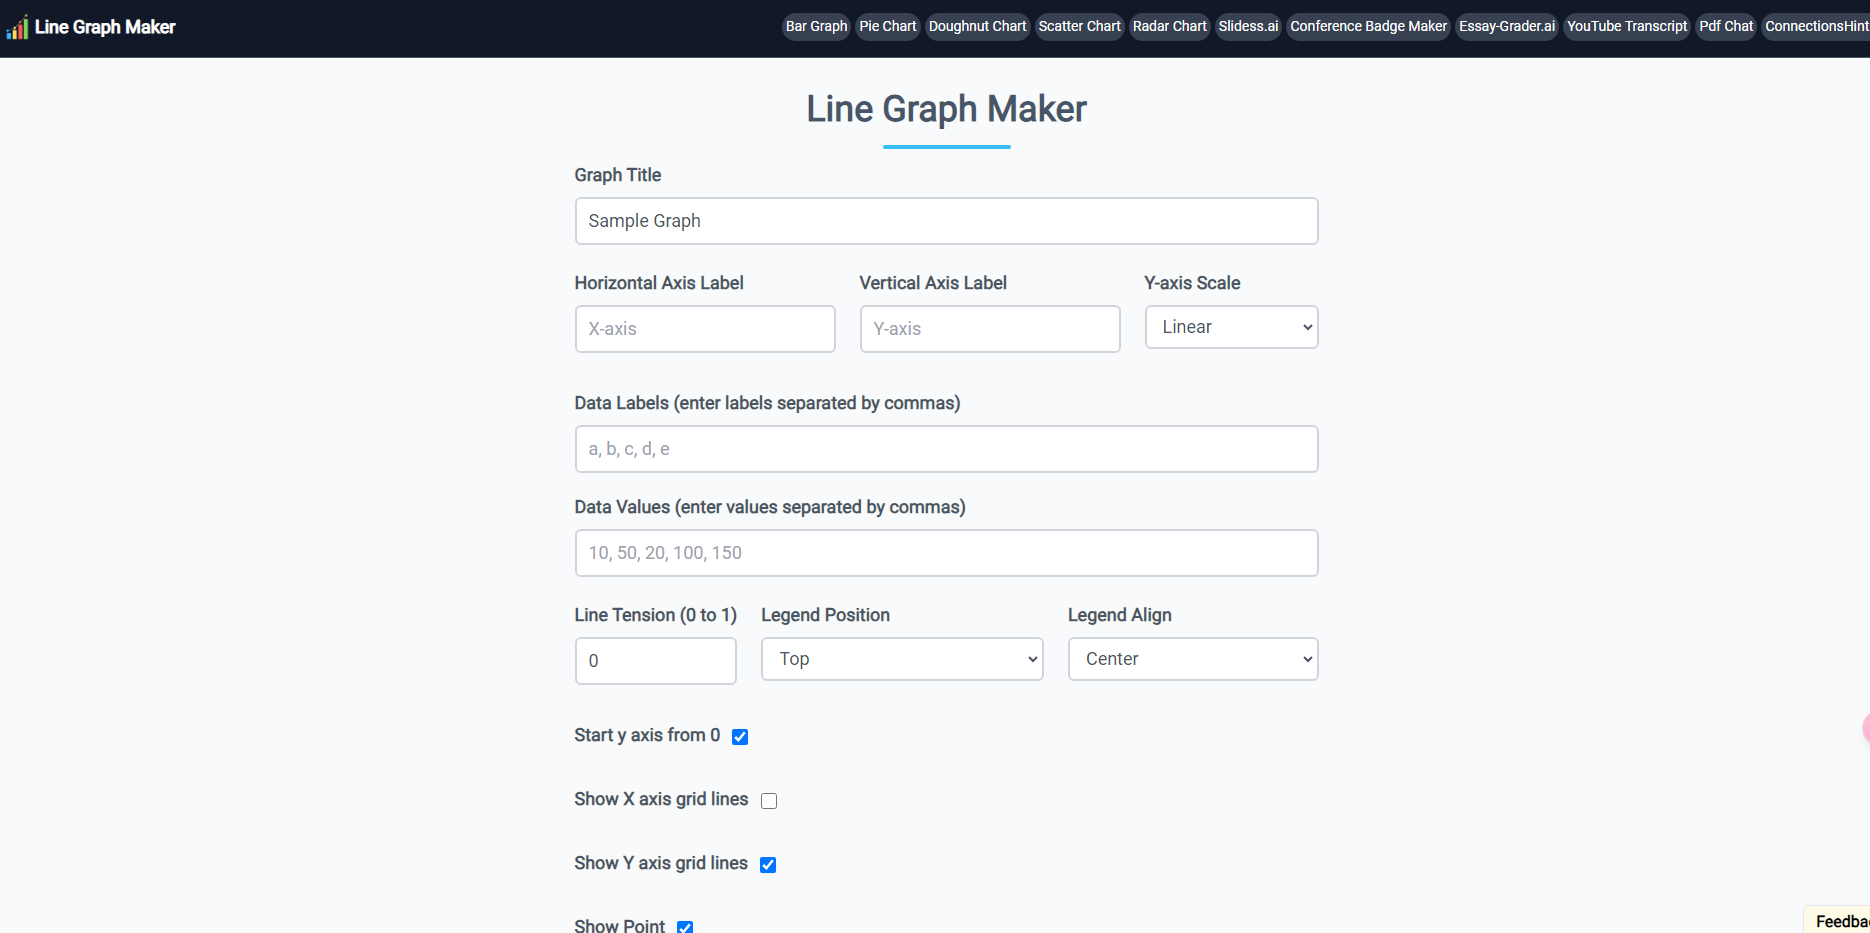
📊 Customizable Axes: Label the X-axis and Y-axis to accurately represent your data.
🎨 Design Flexibility: Adjust line colors, tension, and grid lines to enhance graph clarity and style.
📥 Multiple Download Formats: Save your line graphs as JPG, PNG, or SVG files for easy sharing and printing.
🧮 Data Input Simplicity: Enter data labels and values effortlessly, separated by commas, for quick graph generation.
📑 Legend and Title Options: Add a graph title and position the legend to organize your data presentation effectively.
Use Cases:
A student can create a line graph to visualize data for a science project, adjusting the axes and line colors to make the information clear and visually appealing.
A business analyst can generate a line chart to present quarterly sales data in a report, customizing the grid lines and line tension for a professional look.
A researcher can use the tool to illustrate statistical findings in a study, downloading the graph as a PNG file for publication in a journal.
Conclusion:
The Line Graph Maker stands out as a user-friendly and versatile tool for creating customized line graphs. Its intuitive interface and range of customization options make it an ideal choice for anyone needing to present data visually. Whether for educational purposes, business presentations, or research, this tool simplifies the process of graph creation and ensures high-quality results.
FAQs:
Can I customize the X-axis and Y-axis labels?
Yes, you can easily add custom labels to both the X-axis and Y-axis to accurately represent your data.What formats can I download my line graph in?
You can download your line graph as JPG, PNG, or SVG files.Is it possible to adjust the line tension?
Yes, you can modify the line tension from 0 to 1 to change the curve of the lines on your graph.
More information on Line graph maker
Launched
2022-02
Pricing Model
Free
Starting Price
Global Rank
855487
Follow
Month Visit
38.7K
Tech used
Google Ads,Google Analytics,Next.js,Vercel,Gzip,OpenGraph,Webpack,HSTS
Top 5 Countries
46.32%
11.49%
9.26%
5.93%
5.5%
United States
Philippines
Australia
Indonesia
Vietnam
Traffic Sources
2.17%
0.57%
0.09%
5.91%
60.86%
30.32%
social
paidReferrals
mail
referrals
search
direct
Source: Similarweb (Sep 24, 2025)
Line graph maker was manually vetted by our editorial team and was first featured on 2024-11-20.
Related Searches
Line graph maker Alternatives
Load more Alternatives-

AI Graph Maker simplifies data viz. Create stunning graphs in clicks with AI. Responsive, customizable, multi-format export. Ideal for pros & beginners.
-

Pie Chart Maker is a free online tool. Easily create beautiful pie charts, customize colors & 3D effects. Download in various formats. Ideal for students, businesses & individuals. No design expertise needed.
-

Create a professional chart for free with the first AI-powered graph maker. Make custom bar charts, scatter plots, pie charts, histograms, and line charts in seconds.
-

-

Turn your data into stunning, professional charts in seconds. Just upload your data, describe what you need, and watch the magic happen.