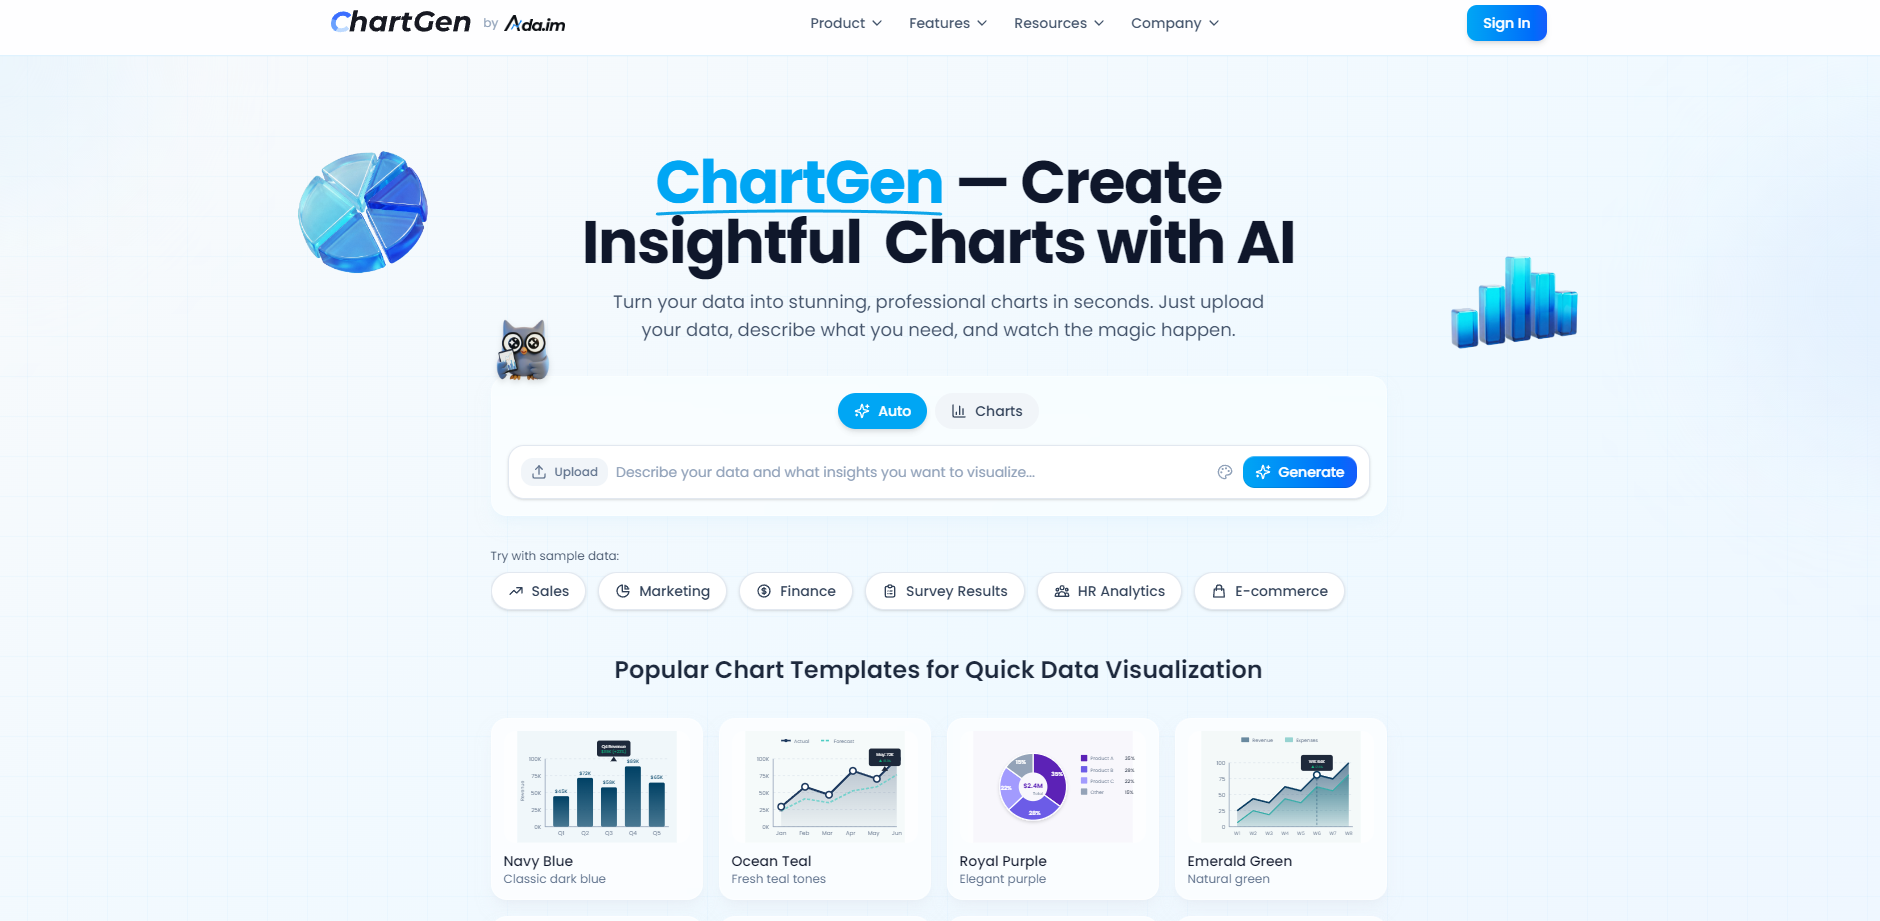
What is ChartGen.ai?
ChartGen is the AI-powered chart generator that transforms complex business data into stunning, professional visualizations in seconds. It solves the pervasive challenge of slow, manual charting by allowing data analysts, marketers, and business leaders to simply describe their visualization needs in plain English. By harnessing advanced natural language processing, ChartGen delivers instant, actionable data insights, making sophisticated data visualization accessible to everyone.
Key Features
ChartGen combines intuitive design with advanced artificial intelligence, enabling you to move from raw data to a presentation-ready visual in under 30 seconds.
💬 Natural Language Chart Creation
Eliminate the need for complex configuration panels or coding. Simply upload your data and describe the required visualization in plain English—for example, "Show me quarterly revenue by region as a bar chart." The AI instantly analyzes your intent, selects the optimal chart type, applies suitable data aggregations (Sum, Average, Count), and generates the final visual.
📊 Comprehensive Chart Type Support
Access a professional suite of visualization tools designed for comprehensive analysis. ChartGen supports 9 professional chart types, including Bar Charts, Line Charts, Pie Charts, Scatter Plots, Heatmaps, Area Charts, and advanced types like Waterfall Charts (perfect for P&L analysis) and Funnel Charts (ideal for conversion tracking).
🔗 Real-Time Data Synchronization
Ensure your reports are always up-to-date by connecting ChartGen to external data sources, including Google Sheets, databases, and over 40 integrations available via the parent Ada.im platform. Charts refresh automatically when your underlying data changes, providing truly live dashboards and reports.
🔒 Enterprise-Ready Security and Compliance
Your data security is paramount. ChartGen is SOC 2 compliant and utilizes end-to-end HTTPS encryption for all data transmission. Files are processed in real-time and are not permanently stored on our servers, ensuring your business data remains private and secure, meeting the needs of both startups and Fortune 500 enterprises.
🎨 Professional Styling and Export
Select from 12 professionally designed color themes, including palettes inspired by leading consulting firms, to ensure brand consistency and visual appeal. Export your high-quality charts instantly as PNG, SVG vector graphics, or PDF documents for seamless integration into presentations, reports, and dashboards.
Why Choose ChartGen?
Teams choose ChartGen because it delivers professional-grade visualization capabilities with unparalleled speed and simplicity, backed by proven reliability and security.
- Verified Speed and Efficiency: With an average generation time of less than 5 seconds, ChartGen drastically cuts down the time spent on data visualization compared to traditional spreadsheet software.
- Trusted by the Global Community: ChartGen is trusted by over 50,000 active users in 110+ countries and has generated over 2 million AI charts. It maintains high user satisfaction ratings (4.8 on G2 and ProductHunt).
- Depth and Customization: Beyond basic charting, ChartGen offers the necessary flexibility, including 9 advanced chart types, 12 professional color themes, and 6 key data aggregation methods (Sum, Average, Count, Min, Max), ensuring the generated visualization is always analytically sound.
Conclusion
ChartGen provides the fastest, most secure, and most intuitive path from complex data to clear, actionable visual insight. Stop wrestling with cumbersome charting tools and start leveraging the power of natural language AI to instantly create professional, presentation-ready data visualizations.
More information on ChartGen.ai
Launched
Pricing Model
Freemium
Starting Price
Global Rank
Follow
Month Visit
<5k
Tech used
ChartGen.ai was manually vetted by our editorial team and was first featured on 2025-12-19.
ChartGen.ai 代替ソフト
もっと見る 代替ソフト-

-

AI Graph Makerは、データの視覚化を簡素化します。AIを活用して、クリックだけで見事なグラフを作成できます。レスポンシブでカスタマイズ可能、マルチフォーマットエクスポートに対応しています。プロにも初心者にも最適です。
-
AI搭載のグラフ作成ツールでプロ並みのチャートを無料で作成しましょう。棒グラフ、散布図、円グラフ、ヒストグラム、折れ線グラフを数秒でカスタマイズできます。
-
-
ChartPixel:煩雑なデータを、セキュアなAIインサイトとインタラクティブなグラフへと変革します。データとの対話を通じて、分かりやすい説明が得られます。コーディングやデータサイエンスの知識は不要です。