What is Quadratic?
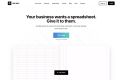
Imagine a spreadsheet that not only crunches numbers but also understands your questions. Quadratic is that spreadsheet. It combines the familiar grid format you know with the power of built-in AI, coding capabilities, and direct database connections. If you've ever felt limited by traditional spreadsheets, or found data analysis intimidating, Quadratic offers a faster, more intuitive way to get answers from your data.
Key Features:
🗣️ Chat with Your Data: Use simple, everyday language to ask questions about your data and get immediate answers, thanks to Quadratic's integrated AI.
📊 Generate Charts Instantly: Describe the chart you envision, and Quadratic's AI will create it for you. No more wrestling with complex chart settings.
🔌 Connect Directly to Databases: Pull data from PostgreSQL, MySQL, Snowflake, and more, directly into your spreadsheet for analysis.
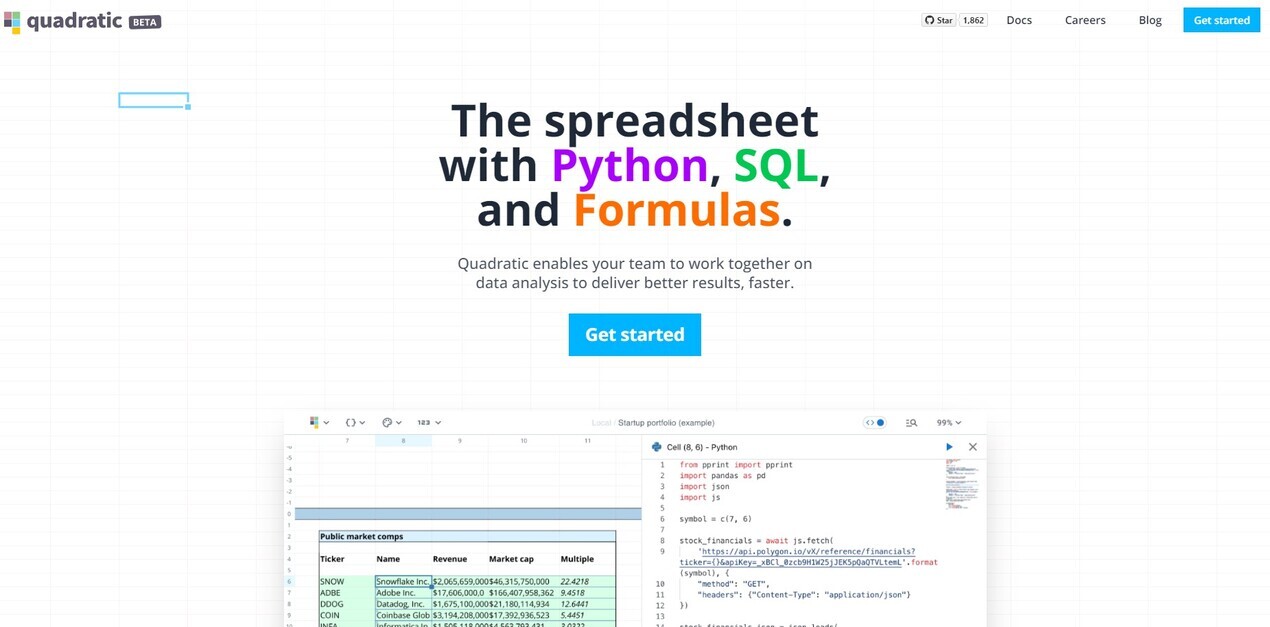
💻 Code in Your Spreadsheet (Optional): For those who want to go further, write and run Python, SQL, and JavaScript directly within cells.
Use Cases:
Marketing Analyst: A marketing analyst can quickly connect to a sales database, ask "What were the top 5 best-selling products last quarter?", and instantly generate a bar chart visualizing the results.
Small Business Owner: A small business owner can import sales data from a CSV file, use AI to identify trends, and create a line chart showing revenue growth over time.
Financial Analyst: Import financial data, and use the AI to help create formulas. Or, if you are a skilled analyst, write Python code to perform custom calculations and build financial models, all within the spreadsheet.
Conclusion:
Quadratic empowers you to unlock the full potential of your data. It's more than just a spreadsheet; it's an intelligent data analysis tool that adapts to your needs, whether you're a beginner or an expert.
More information on Quadratic
Launched
2022-04
Pricing Model
Freemium
Starting Price
$20 /user/month
Global Rank
173044
Follow
Month Visit
217K
Tech used
Google Analytics,Next.js,Vercel,Webpack,HSTS
Top 5 Countries
35.1%
10.03%
4.83%
4.81%
4.78%
India
United States
United Kingdom
Canada
Russia
Traffic Sources
8.47%
3.39%
0.27%
7.09%
45.23%
35.55%
social
paidReferrals
mail
referrals
search
direct
Source: Similarweb (Sep 24, 2025)
Quadratic was manually vetted by our editorial team and was first featured on 2023-05-02.
Related Searches
Quadratic Alternatives
Load more Alternatives-
-

-
Tired of complex data? Formula Bot is your AI data analyst. Get insights, visualize & clean data by asking questions in plain English.
-

SheetQuery for Google Sheets. AI-driven data analysis, task automation, formula generation. Boost productivity. Flexible pricing. Unlock spreadsheet potential.
-